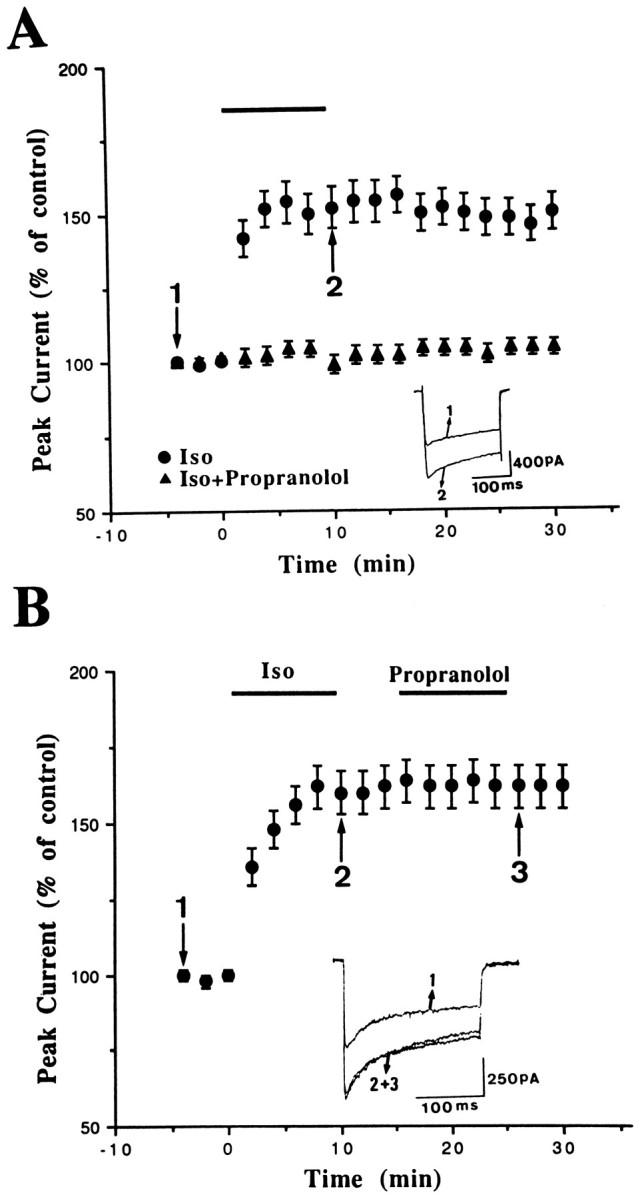
Fig. 4.

Persistent enhancement ofICa by Iso. A, The percent change of peak ICa was plotted as a function of time.Bar denotes the periods of delivery of Iso (15 μm) or Iso plus propranolol (1 μm). The Iso-induced potentiation was prevented by concurrent application of propranolol. B, Delayed application of propranolol afterICa enhancement did not affect Iso-induced potentiation significantly.
