
Fig. 5.
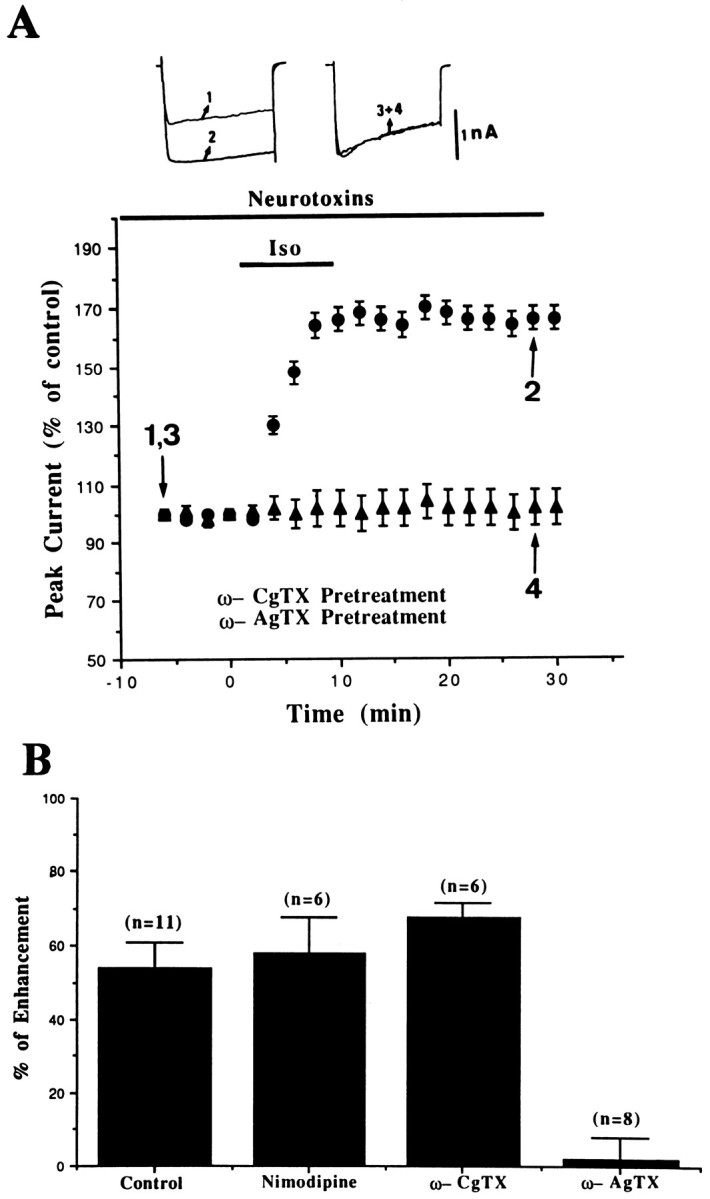
Selective blockade of Iso-induced enhancement ofICa by ω-AgTX. A, The percent change of ICa was plotted as a function of time. The isolated amygdalar neurons were incubated in 1 μm ω-CgTX or 10 nm ω-AgTX for at least 10 min before recordings were made. B, Thebars represent the enhancement ofICa (mean ± SEM) by Iso in control and after application of various types of Ca2+ channel blockers.