
Fig. 4.
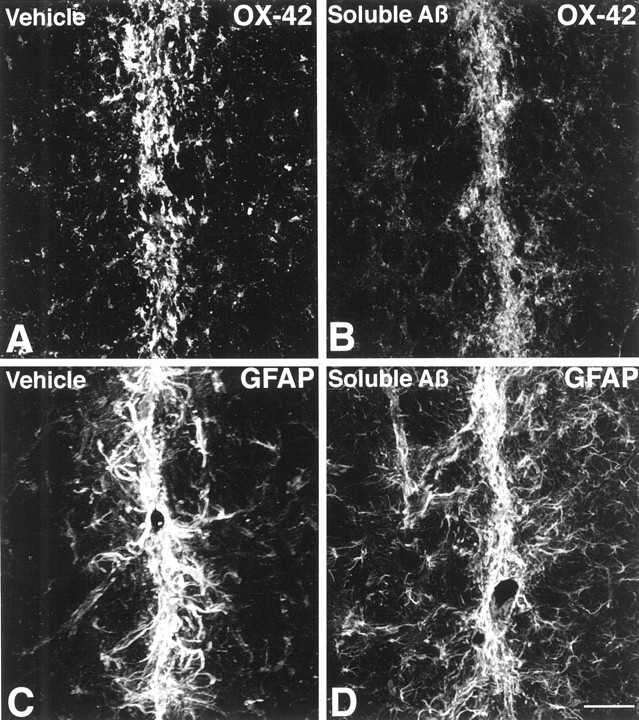
Microglia and astrocyte responses 30 d after vehicle or sAβ injection are shown. A,B, No difference in OX-42 immunofluorescence is observed in the needle track after vehicle or sAβ injection. C,D, Similarly, no difference in GFAP immunofluorescence is observed in the needle track after vehicle or sAβ injection. Images are Kalman averages of a single optical section acquired using a 20× lens. Scale bar, 50 μm.