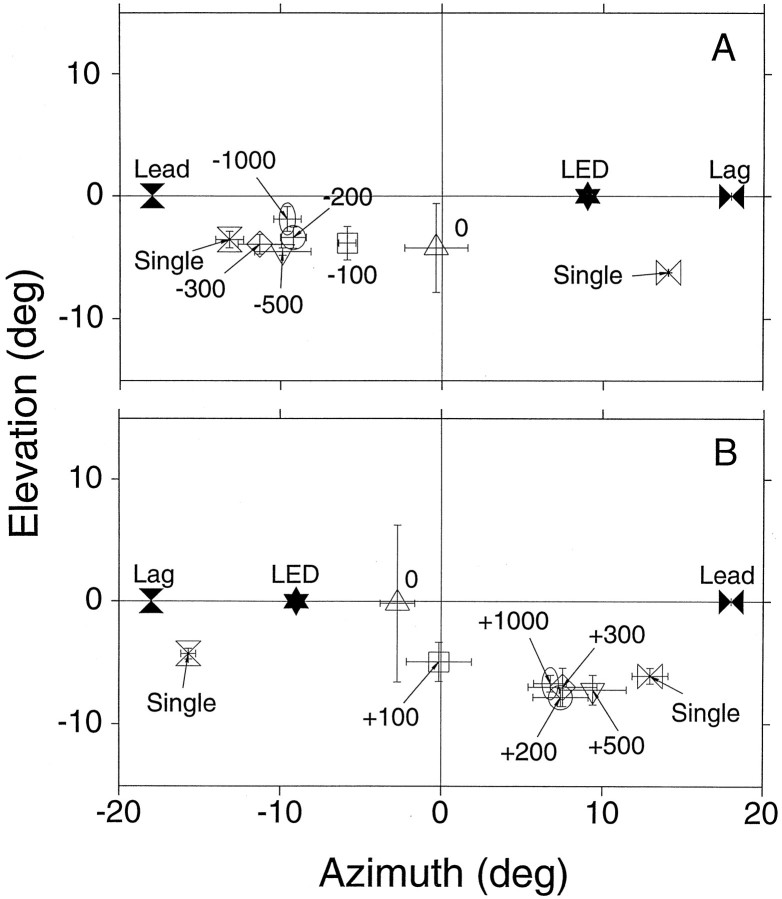
Fig. 14.
Summing localization: ICD series summary. Mean final eye position from the negative (A;n = 36 trials) and the positive (B;n = 42 trials) ICD conditions. The position of the fixation LED is illustrated by a filled star; the position of the leading (Lead) and lagging (Lag) speakers are labeled. The mean final eye positions for the various ICDs are illustrated by the open symbols. Bars represent the confidence intervals computed as in Figure 5. The point for the single click presented from the right speaker in A represents two data points only.

