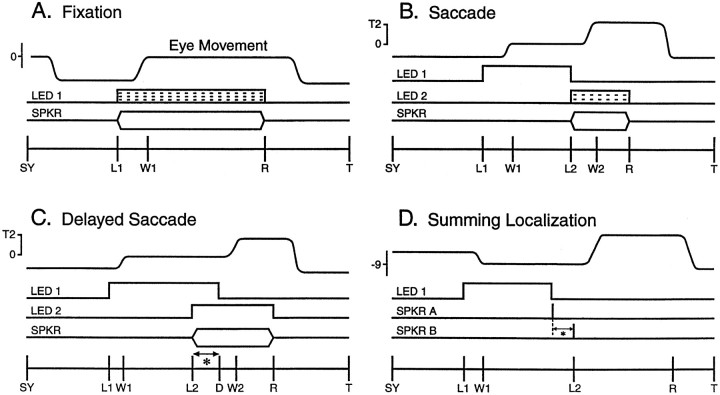
Fig. 2.
Schematic diagram of the behavioral tasks. A, Fixation; B, saccade; C, delayed saccade; and D, summing localization. Each panel shows the following fromtop to bottom: the expected eye movement, visual (LED) and auditory (SPKR) target onset and offset, and the sequence of the behavioral events. Targets could be visual, auditory, or combined modality. SY, Synchronization pulse stored in the computer record to mark start of the trial; L1, fixation LED onset; W1, W2, eye into acceptance window; D, delay;L2, target onset; R, reward;T, end of trial. A, Fixation task. The animal was required to saccade to the target and to maintain fixation within the acceptance window surrounding the target. The broken lines within the LED represent the progressive dimming of the visual component of the combined stimuli used during the early stages of sound localization training. B, Saccade task. At the end of the fixation event (LED 1), another target was presented at a different location. To receive a reward the cat had to fixate LED 1 and then saccade to the location of the newly presented target until the reward (R) was delivered. C, Delayed saccade. The target was presented before the offset of the fixation event (LED 1). The signal for the cat to move to the target was given by theoffset of LED 1; thus the delay, indicated by the asterisk, is the time during whichLED 1 and target (LED 2 orSPKR) overlap. D, Summing localization. Coinciding with the end of a fixation event (LED 1), a pair of 100 μsec clicks is presented from two speakers at (±18°,0°) with ICDs (indicated by the asterisk) ranging over ±1000 μsec.

