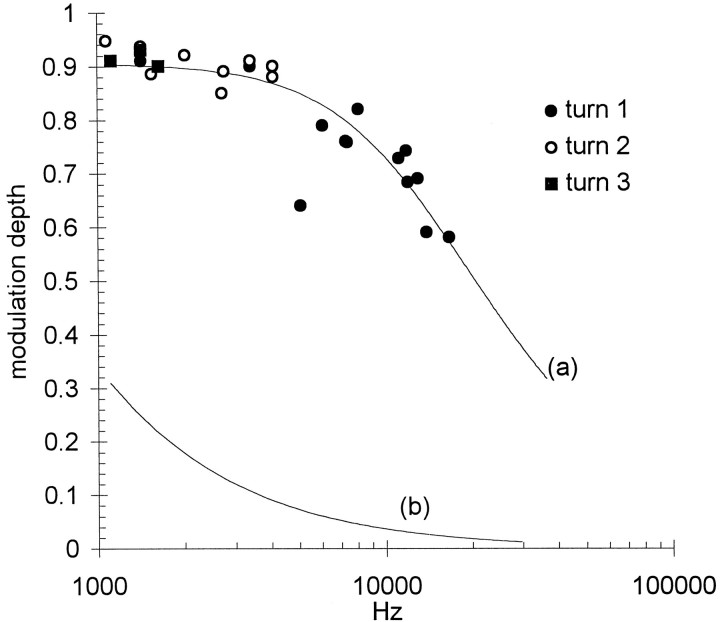
Fig. 6.
Modulation depth diminished with increasing emission frequency. EEOAEs from three cochlear turns were modulated at saturating sound levels. Curve (a) describes the frequency response of a simple low-pass filter fitted to the data by the least squares method. The 3 dB corner frequency is 13.6 kHz. Curve (b) describes for comparison (see Discussion) a filter with a corner frequency of 400 Hz.

