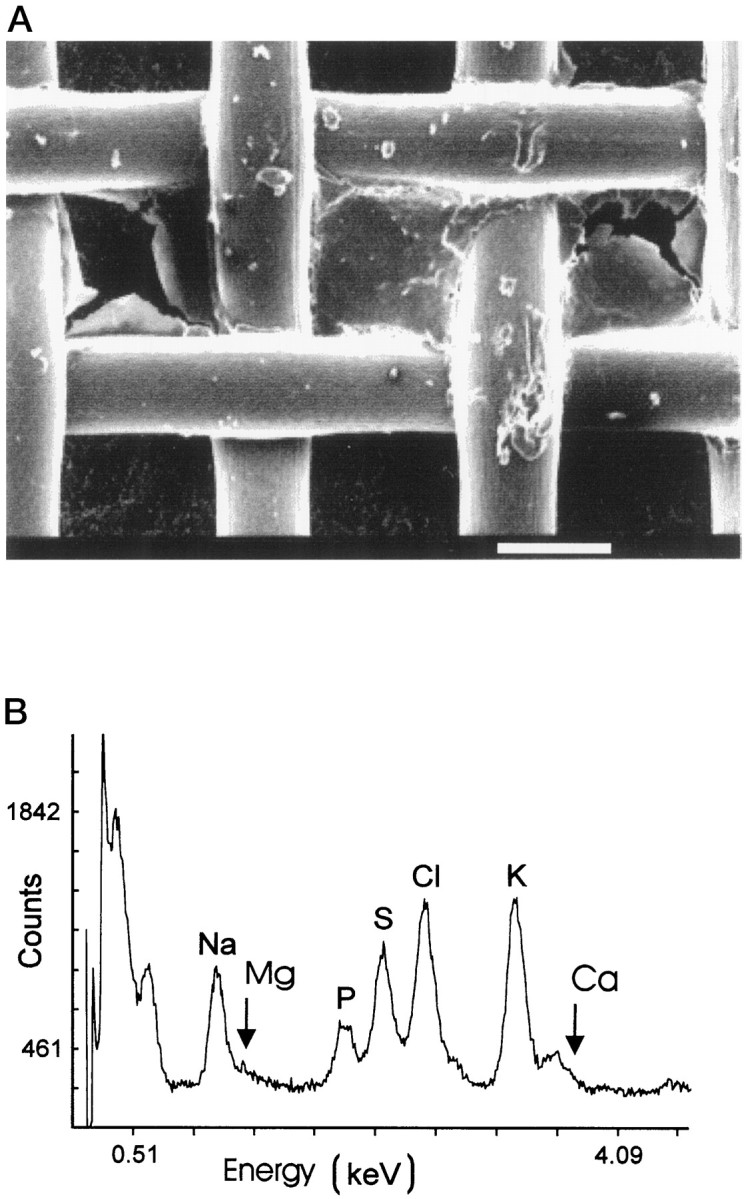
Fig. 4.

Determination of Cl/K ratios in isolated samples of olfactory mucus. A, Scanning electron micrograph of a nylon grid containing a small sample of desiccated olfactory mucus. Scale bar, 100 μm. B, EDX spectrum obtained from an isolated mucus sample. The characteristic peaks (Kα) are designated with element symbols. The Mg peak is near the detection limit, and the Ca signal is partially hidden under the KKβ peak.
