
Fig. 10.
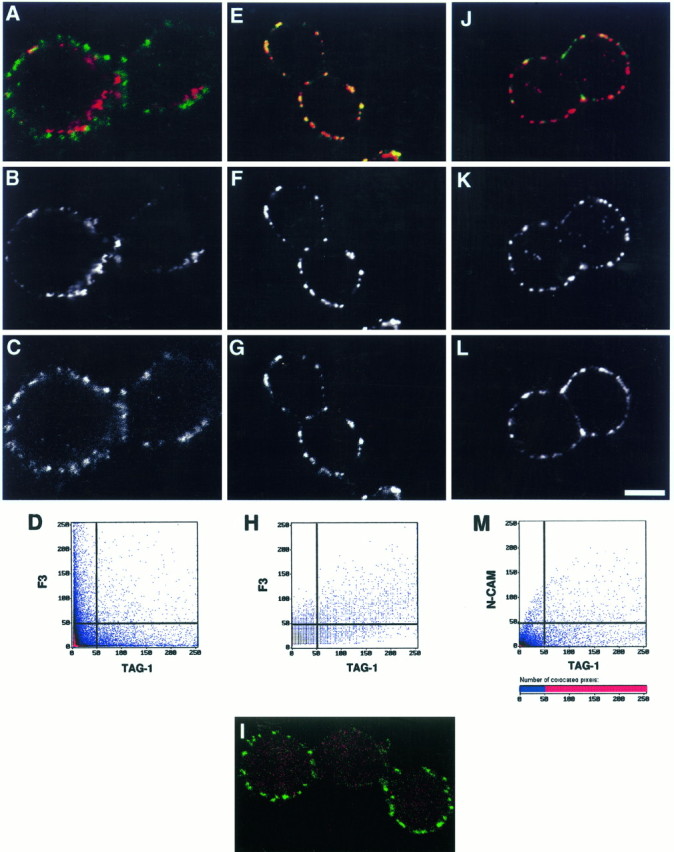
Co-clustering of F3 and TAG-1 at membrane of CHO cells visualized by immunofluorescence. Double-transfected F3-TAG-1-A CHO cells were plated on glass coverslips. A–D, TAG-1 (B) and F3 (C) were detected using double-immunofluorescence staining in control conditions and displayed a nonoverlapping distribution pattern (A, D).E–M, Clustering of TAG-1 was induced with anti-TAG-1 mouse IgM monoclonal antibody and Texas Red-conjugated anti-mouse IgM secondary antibody (F, K). Under these conditions, F3 immunoreactivity (G) was induced to co-cluster with TAG-1 (E), whereas N-CAM immunoreactivity (L) only slightly colocalized with TAG-1 clusters (J). A portion of the cell population from the F3–TAG-1-A cell line expressed F3 alone and did not showed clustering of F3 (I). Cells were optically sectioned in the (Figure legend continues) x–y plane in eight slices (1 μm thick); representative midlevel sections are shown (yellow, colocalized pixels;green, F3 or N-CAM; red, TAG-1). Scale bar: 7 μm. Cell surface expression of TAG-1 was simultaneously analyzed with F3 or N-CAM expression by two-channel recording (A, E, I, J). Shown are two-dimensional dot blot representations (D, H, L) of the relative fluorescence intensity; x-axis, TAG-1 fluorescence;y-axis, F3 (D, H) or N-CAM fluorescence (L).