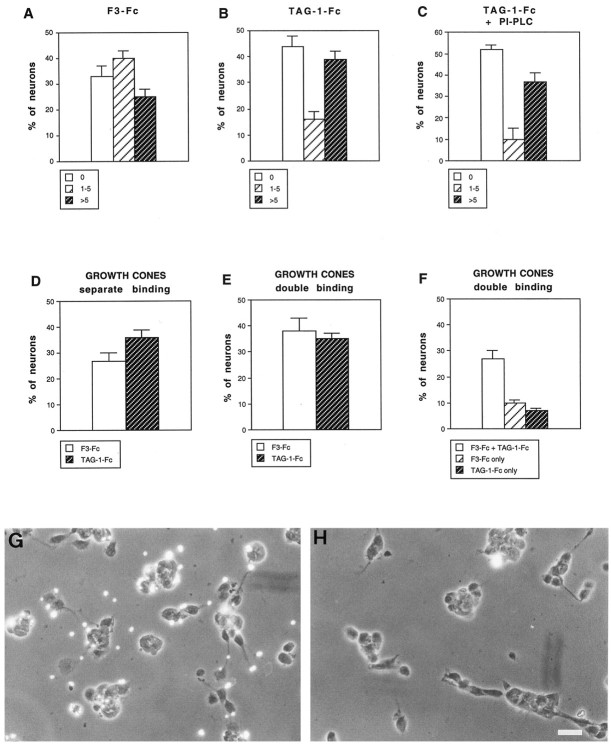
Fig. 8.
Quantitative analysis of F3-Fc and TAG-1-Fc fluosphere binding on cerebellar neurons. Dissociated cerebellar cells were cultured for 1 d and incubated for 1 hr with red fluorescent fluospheres conjugated with anti-human Fc antibodies and F3-Fc (A) or TAG-1-Fc (B, C) chimeras. Distribution is shown as percentage of neurons that displayed no bead (0), between 1 and 5 beads (1–5), and more than five beads (>5). C, Neurons were incubated with PI-PLC to remove GPI-anchored molecules from the cell surface. Note that TAG-1-Fc microsphere binding was not modified. D, E, Percentage of neurons that showed more than three beads conjugated with F3-Fc or TAG-1-Fc on their growth cone when beads were incubated separately (D) or simultaneously (E). F, Percentage of neurons with double-labeled, F3-Fc only-labeled, and TAG-1-Fc only-labeled growth cones in double-binding experiments. Mean ± SEM of three independent experiments. More than 120 neurons were analyzed under each experimental condition. G, H, F3-Fc microspheres were incubated for 1 hr at 4°C with rabbit nonimmune (G) or anti-F3 Igs (H) at a concentration of 0.1 mg/ml before incubation for 1 hr with cerebellar neurons cultured for 1 din vitro. Note that in H the binding of fluorescent F3-Fc beads was almost entirely prevented by preincubation with anti-F3 Igs. Scale bar, 10 μm.

