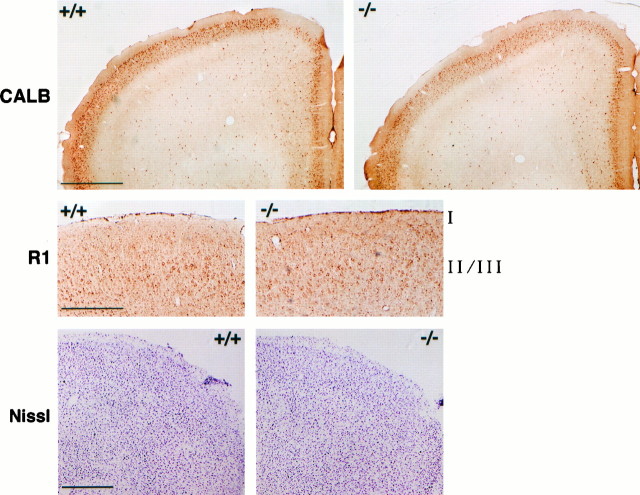
Fig. 7.
Cytoarchitecture of the frontal cortex. Immunoreactivity of calbindin (CALB) (top), immunoreactivity of NMDAR1 (R1) (middle; showing the motor cortex), and Nissl staining (bottom; showing the dorsolateral quadrant of the frontal cortex) are shown. Scale bars: top,bottom, 500 μm; middle, 250 μm. The figure is representative of results obtained from analysis of four wild-type littermates (+/+) and four fosB mutant mice (−/−).

