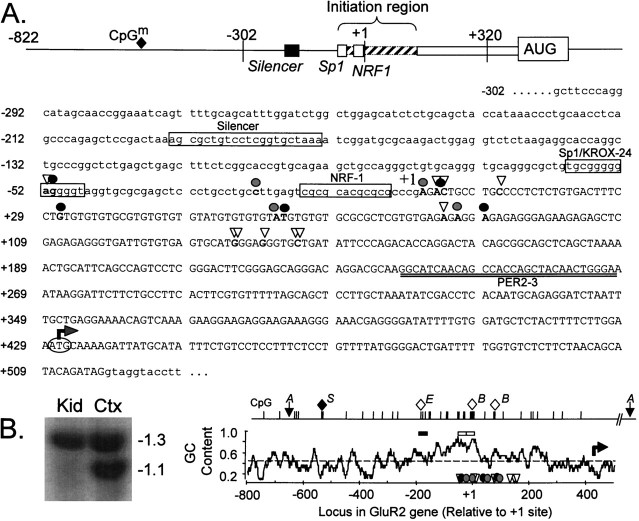
Fig. 1.
Features of the rat GluR2 promoter and 5′-flanking region. A, Schematic showing the salient features of the GluR2 promoter region and partial nucleotide sequence of the GluR2 5′ proximal promoter region, exon 1, and part of intron 1. The exon 1 sequence is in uppercase with the 5′ promoter and intron 1 sequences in lowercase letters. mRNA 5′ ends identified by 5′ RACE analysis are indicated by open triangles, and those identified by RNase protection and primer extension are indicated by solid or gray circles, respectively. The 5′-most prominent initiation site has been designated as the +1 transcription initiation site, located 429 bases 5′ of the GluR2 AUG (bent arrow). Consensuscis element sequences for the GluR2 silencer element and Sp1/Krox-24 and NRF-1 transcription factors are identified by name adjacent to the corresponding boxed sequence. The boundaries of the initiation site region and the location of the methylated CpG dinucleotide (CpGm; filled diamond) are indicated in the schematic. The location of the antisense PER2–3 oligonucleotide used for primer extension reactions is indicated by double underlining below the nucleotide sequence. B, GC content of the GluR2 promoter and exon 1 and a methylation-sensitive Southern blot. The average GC content ± 10 bp surrounding a central nucleotide was calculated and plotted along the length of the GluR2 promoter. The dashed linerepresents the average GC content (49.7%) for the whole 1.35 kb GluR2 promoter sequence shown. Open triangles, solid circles, and gray circles refer to RACE, RNase protection, and primer extension sites, respectively, as described inA. The solid and open horizontal bars above the GC plot represent the location of the GluR2 silencer and the Sp1/Krox-24 and NRF-1 regions, respectively. Also shown are the locations of CpG dinucleotides in the GluR2 promoter. The methylation state of the CpG dinucleotides was evaluated by sensitivity to SacII, Eco47III, andBssHII restriction digestion and represented byS, E, and B, respectively. The filled diamond represents a methylated CpG dinucleotide in kidney and lung but not in cortex and cerebellar DNA, whereas open diamonds indicate unmethylated CpGs in the DNA from all four tissues. The blot atleft is an example of an AccI- andSacII-restricted Southern blot showing tissue-specificSacII digestion in cortex (Ctx) but not in kidney (Kid) DNA; lung and cerebellar Southern blots are not shown. The 1.3 kb fragment between the two AccI sites (A) was radiolabeled as probe.

