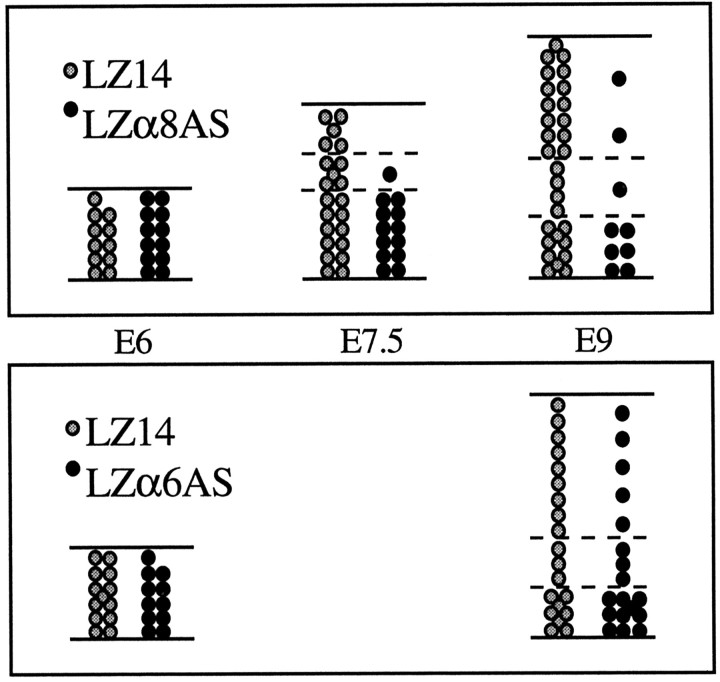
Fig. 12.
Summary data. The effects of antisense α8 and α6 sequences on the clonal development of tectal cells are shown in this quantitative summary diagram. Each circle,solid or stipled, represents a cell, and the number of cells shown are the mean numbers of cells at each age. Data are taken from Tables 1-5.

