
Fig. 7.
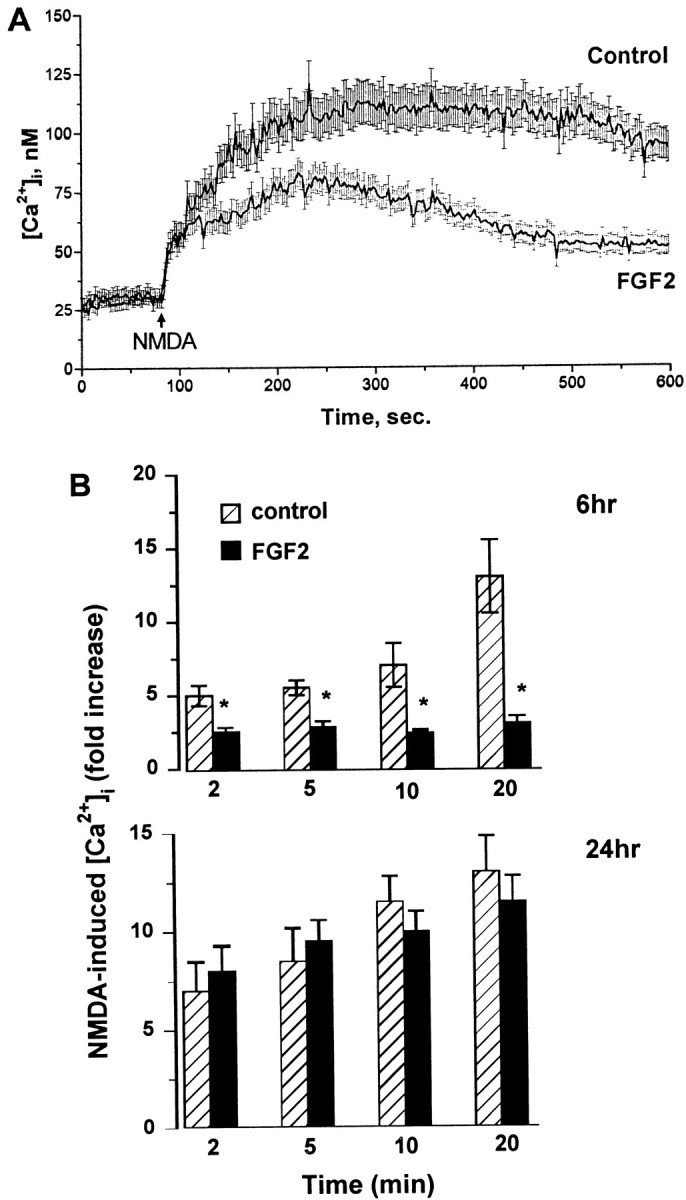
Inhibitory effect of FGF2 on the NMDA-evoked [Ca2+]i increase. Cerebellar granule cells were exposed to serum-free medium for 6 or 24 hr in the absence (control, vehicle-treated) or presence of FGF2 (50 ng/ml). [Ca2+]i imaging was performed as described in the legend of Figure 6. A, Representative of NMDA-induced Ca2+ response in neurons exposed to FGF2 or vehicle for 6 hr. B, Time course of the effect of FGF2 on the NMDA-induced [Ca2+]iincrease. The single-cell [Ca2+]iincrease after NMDA was measured in neurons exposed to FGF2 for 6 or 24 hr. Data are expressed as an NMDA-induced fold [Ca2+]i increase plotted against time after NMDA addition and represent the mean ± SEM from a population of 65 (control) and 70 (FGF2-treated) neurons per coverslip from four separate preparations of cerebellar granule cells (each preparation included at least three coverslips). *p< 0.05 (ANOVA and Dunnett’s test).