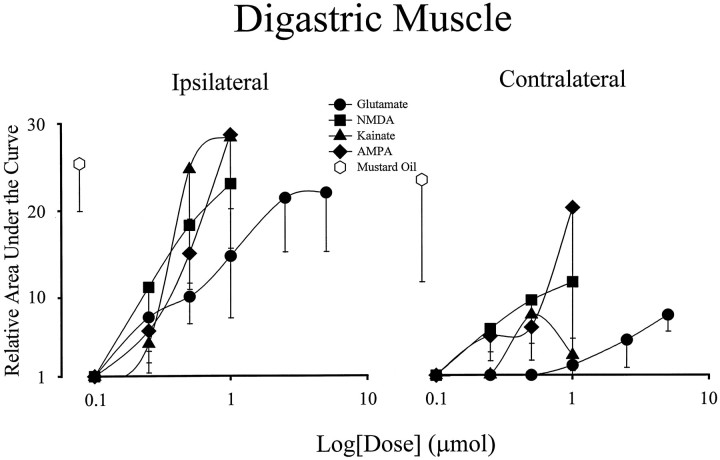
Fig. 2.
Dose–response relationship for evoked activity in the digastric muscles by application of EAA receptor agonists to the TMJ region. Each data point on the dose–response curves represents a mean value (n = 6). Error bars indicate SE. Note that responses of magnitude similar to those evoked by MO in the ipsilateral digastric were achieved with 0.5 μmol doses of NMDA, AMPA, and kainate and 2.5 μmol doses of glutamate, respectively.

