
Fig. 2.
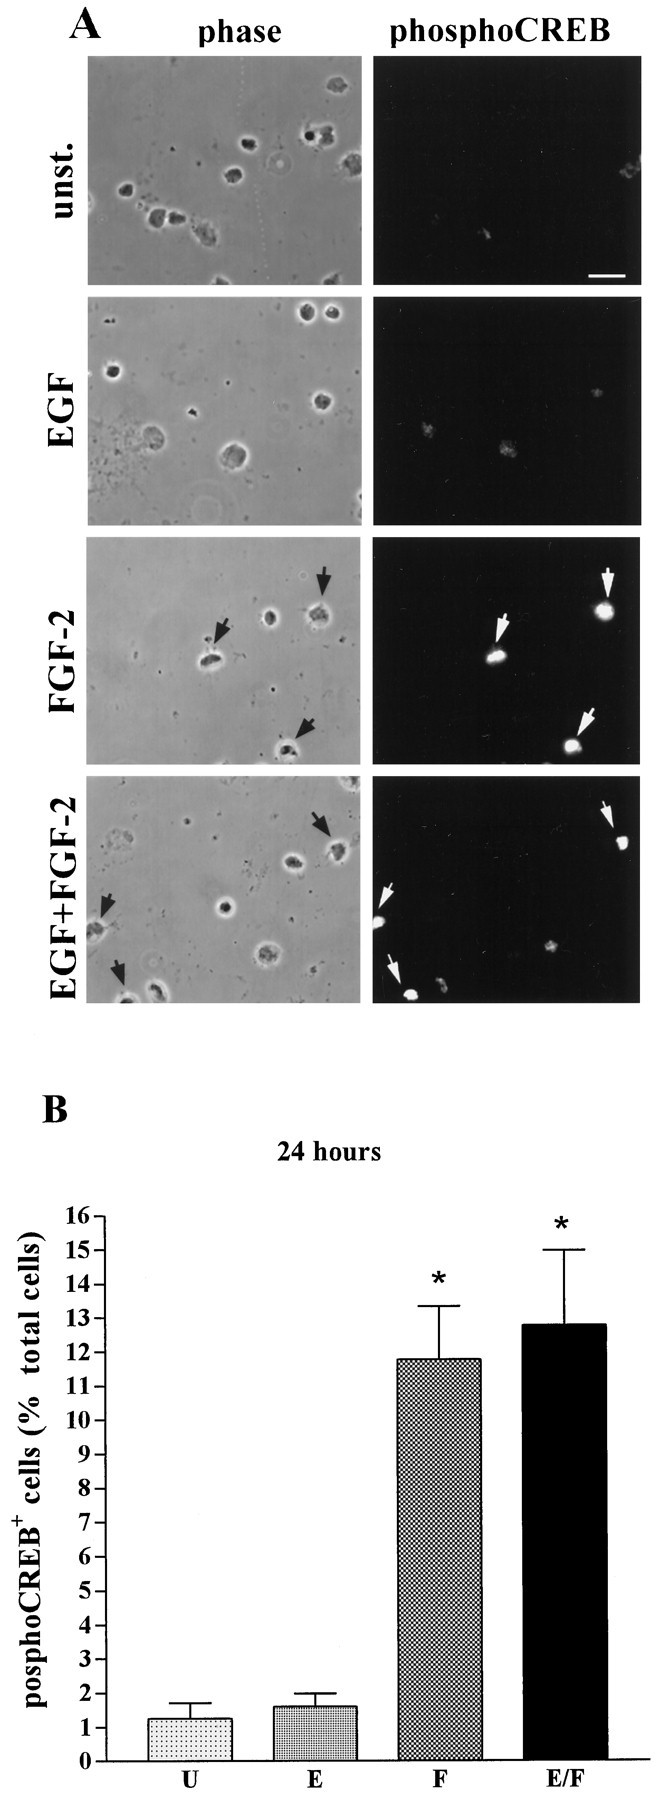
FGF-2-induced CREB phosphorylation in mouse E14 striatal cells cultured in vitro for 24 hr.A, Examples of phospho-CREB immunostaining (right panels) and corresponding phase-contrast pictures (left panels) of unstimulated cells (unst.) or after stimulation with the indicated growth factors. Arrowsindicate phospho-CREB-immunopositive cells. Scale bar, 10 μm.B, Quantitative analysis of CREB phosphorylation in unstimulated cells (U) and in cells stimulated with EGF (E), FGF-2 (F), or a combination of EGF and FGF-2 (E/F). Data represent the means of five independent experiments. For each condition >5000 cells were counted. *Significantly different from unstimulated (p < 0.001).