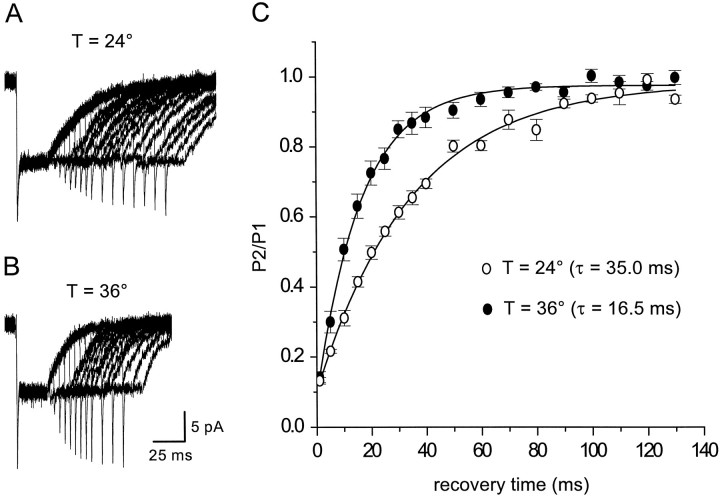
Fig. 3.
Recovery time course ofd-aspartate-evoked transporter currents. A,B, d-aspartate (10 mm) was applied to an outside-out patch from astrocytes for 30 msec and then reapplied for 20 msec after a variable delay, at both 24°C (top traces) and 36°C (bottom traces).Traces are averages of five consecutive responses recorded at −90 mV. KSCN-based internal solution. C, Summary plot of the ratio of the peak amplitude of the second pulse (P2) over the peak amplitude of the control response (P1) for recordings made at both 24°C (n = 4) and 36°C (n = 10). The four patches used to measure the recovery at 24°C were also used to measure the recovery at 36°C.

