
Fig. 2.
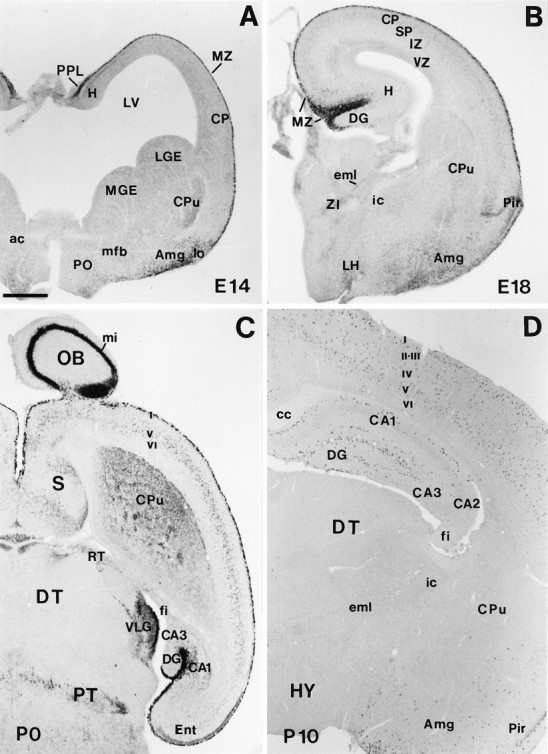
Low-power views illustrating the main features of reelin mRNA distribution from E14 to early postnatal stages. A, Coronal section showing strongreelin expression in the preplate (PPL), marginal zone (MZ), and amygdala (Amg) at E14. B, Coronal section at E18 showing highreelin labeling in the MZ. Very weak staining can be detected at this stage in the cortical plate (CP). C, Horizontal section at P0; the olfactory bulb (OB), cortical layer I (I), hippocampal MZ, and the ventral lateral geniculate nucleus (VLG) show the higher expression levels. High labeling is also found in the caudate-putamen (CPu), in some septal (S) divisions, in the pretectum (PT) at the level of the posterior commissure, and in different cortical and hippocampal layers. D,Coronal section showing the distribution of reelintranscripts at P10. Labeled cells are seen throughout the cortical layers I–VI, hippocampus (H), and Amg. ac, Anterior commissure; CA1, CA2, CA3, hippocampal subfields;cc, corpus callosum; DG, dentate gyrus;DT, dorsal thalamus; eml, estria medularis; fi, fimbria; HY, hypothalamus;i, internal capsule; IZ, intermediate zone; LGE, lateral ganglionic eminence;LH, lateral hypothalamus; lo, lateral olfactory tract; LV, lateral ventricle;mfb, medial forebrain bundle; MGE, medial ganglionic eminence; mi, lamina cellularum mitralium;Pir, piriform cortex; PO, preoptic area;RT, reticular thalamic nucleus; SP,subplate; VZ, ventricular zone; ZI, zona incerta. Scale bar, 500 μm.