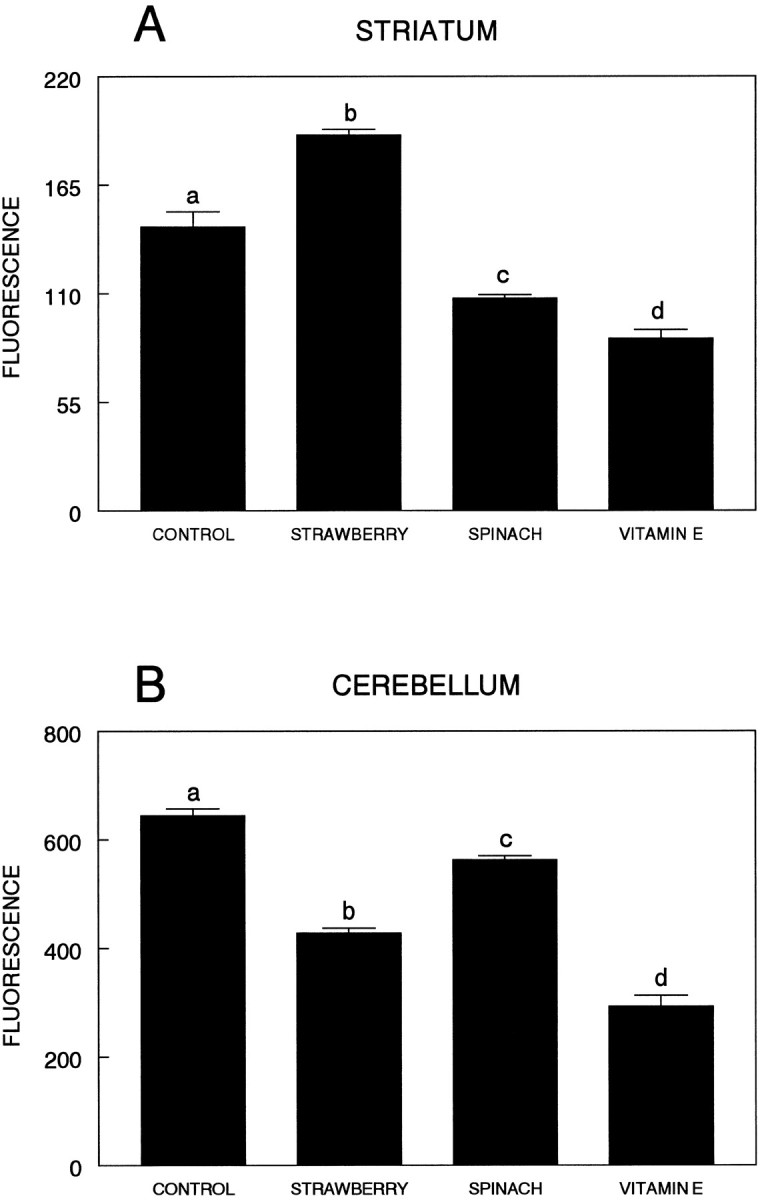
Fig. 6.

Interaction of diets and oxidative stress in striatum (A) and cerebellum (B). Oxidative stress in brain tissue was evaluated by using DCFH-DA, as described in Material and Methods. Data for the formation of reactive oxygen species were obtained from 6–13 individual animals per group, performed with 6–10 replicates, and expressed as mean ± SEM. For this figure, means not sharing a common letter are significantly different (p< 0.01).
