
Fig. 8.
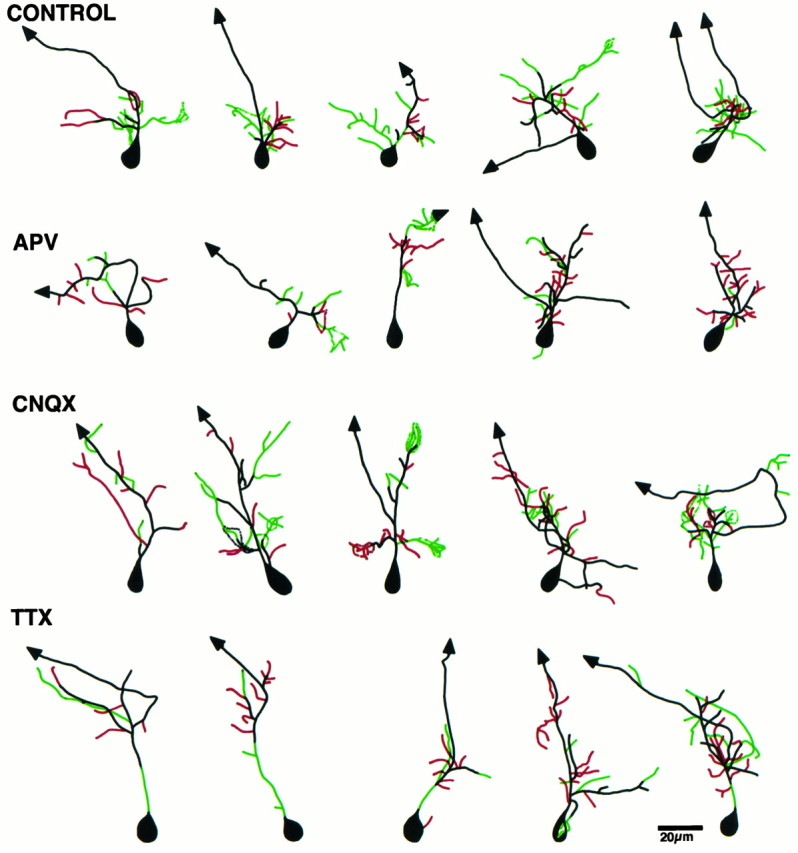
Color-coded drawings reveal arbor dynamics. Composite line drawings were obtained by superimposing the drawings from the 4 hr time point onto the 0 hr time point. The stable branches of the arbor are shown in black, branch additions and extensions in green, and branch retractions inred. Control neurons show more branch length additions compared with retractions. APV-treated neurons show fewer additions than controls.