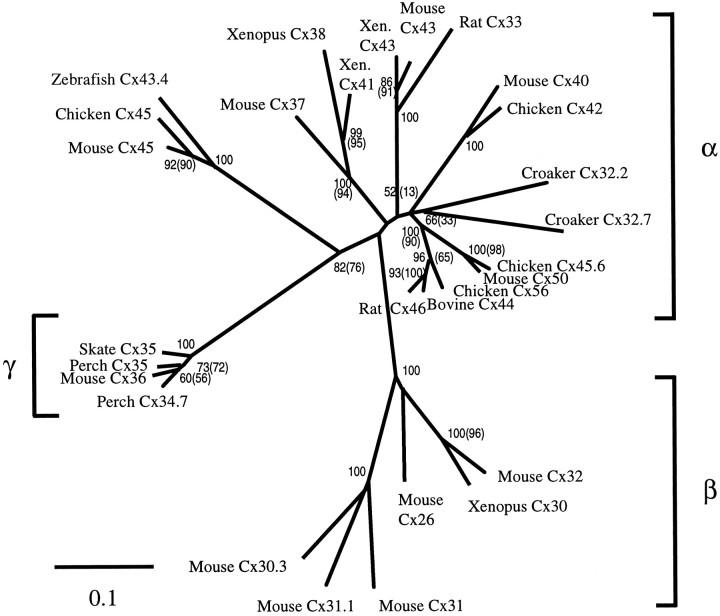
Fig. 9.
Relationships of retinal connexins to the connexin gene family. The tree represents a distance matrix analysis of the nucleotide sequences of the conserved portions of the coding regions of each connexin (see Materials and Methods). A sequence divergence of 10% is indicated by the scale bar. Bootstrap analyses were performed using both distance matrix and parsimony methods to estimate the support for each node in the tree. Both analyses gave the same topology, and bootstrap values (percent of 1000 bootstrap replicates containing the node) are indicated at the nodes. The bootstrap value for the distance method is written first, followed inparentheses by the value for the parsimony analysis, if different. Bootstrap values <50% were not included. The α and β subgroups of connexin genes are labeled with brackets on the right. The novel γ subgroup defined by this study is bracketed on the left.

