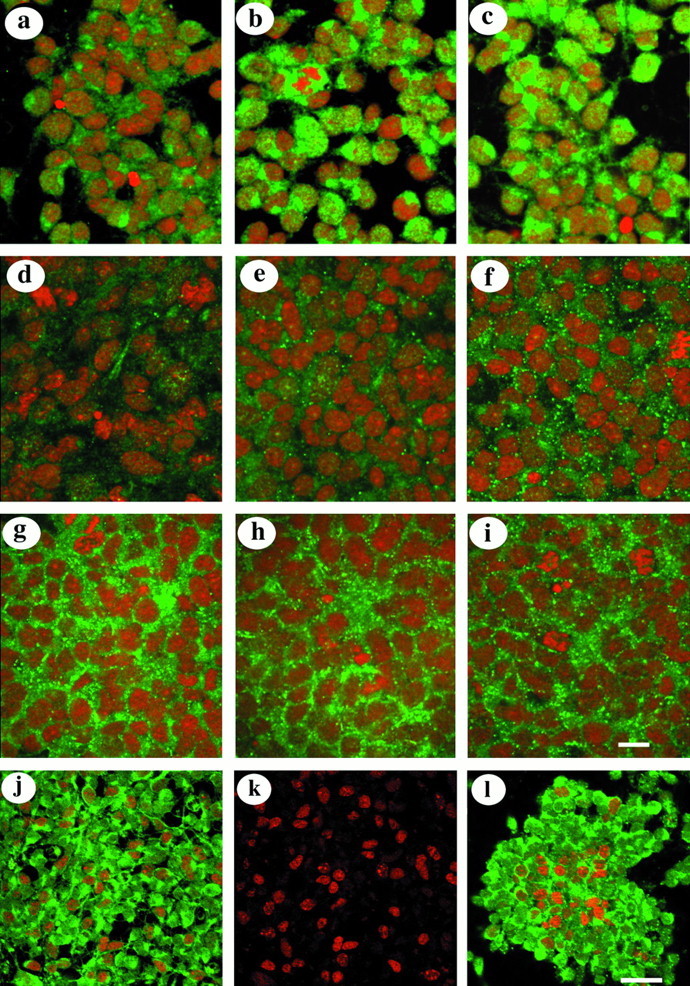
Fig. 3.

Immunocytochemical analyses of cultures after different treatments. Connexin staining is shown ingreen, and propidium iodide labeling of nuclei is shown in red. a–c, Images taken from cultures maintained initially in 10% FCS and later changed to medium containing 0.5% serum before exposure to bFGF in serum-free medium for 4 hr.d–f, Images of cultures that were transferred to medium containing cycloheximide for a period up to 6 hr after bFGF treatment.g–i, Images of cultures treated with MTA and bFGF.a, d, and g are images of control cultures, whereas b, e, andh and c, f, andi are from cultures treated with 10 and 20 ng of bFGF, respectively. Scale bar: a–i, 100 μm. j, k, Images of bFGF-treated cultures stained for BrdU (k) or double-labeled for BrdU and Cx 43 (j). (l) Image of a culture double-labeled for PCNA and Cx 43. Connexin staining is shown ingreen, and BrdU/PCNA-labeled nuclei are shown inred. Scale bar: j–l, 80 μm.
