
Fig. 7.
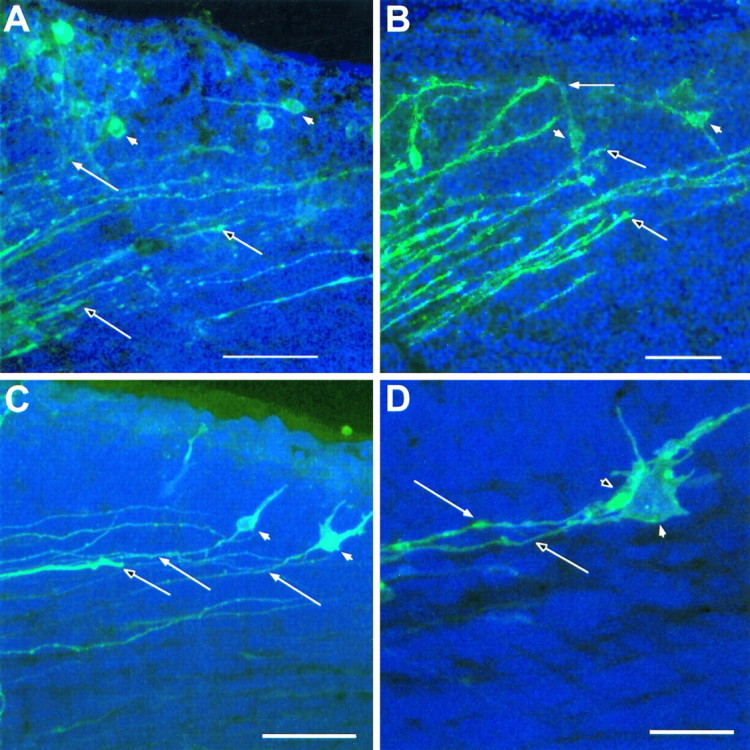
Further examples showing both efferent and afferent axons, labeled with a single crystal of DiI in the internal capsule of reeler. In these cases, thalamic axons have grown through the cortical plate and are invading the superplate layer. Each panel is an extended focus reconstruction, from a stack of thin confocal images, of part of the dorsolateral cortex of the left hemisphere (lateral is up; dorsal is right; pial surface near the top of each image). As in Figures 5 and 6,unfilled arrows mark definite thalamic fibers, identified by growth cones visible within the section; filled arrows show corticofugal axons that can be traced to cell bodies, which are themselves indicated with filled arrowheads. The sections inA, C, and D were counterstained with acridine orange, and cell nuclei appear blue. Although the pial surface is not revealed in the bright-field image that forms the background in B, it lies immediately above the upper limit of the fluorescent axons and cells. A, In this example at E14.5, the most advanced thalamic fibers are entering the lower part of the superplate (similar to the examples in Figs. 5E, 6).B, This enlargement of part of the view in Figure5B, also from an E14.5 reeler, shows some thalamic axons in the immediate vicinity of labeled superplate cell bodies. C, This view from an E15 reeler shows very clear association between a stout thalamic axon and the fiber of a bipolar superplate cell. Note that the thalamic axon lies in the middle of the array of fine corticofugal axons and is not segregated from them, even here, within the superplate layer. D, In this further example from an E15 reeler a back-labeled superplate cell (darker profile in front), whose chromatin, revealed with acridine orange counterstaining, appears blue here, lies immediately adjacent to and partly obscures a large bright profile, which contains no chromatic and is thus identified as a growth cone, presumably of a thalamic axon. The thalamic fiber and that of the preplate cell run parallel and in close association. The growth cone and the soma are so close together that no gap can be resolved between them in the three-dimensional reconstruction. Confocal reconstructions:A, 16 sections × 1.5 μm intervals; B, 32 × 1.0 μm; C, 32 × 1.6 μm; D, 32 × 1.0 μm. Scale bars: A, 200 μm; B, C, 50 μm; D, 10 μm.