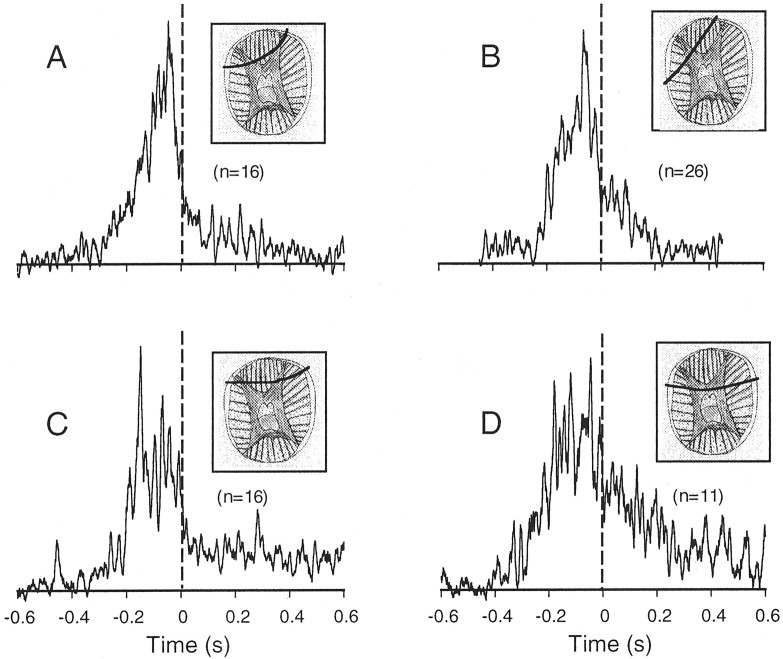
Fig. 5.
Average EMG profiles measured during bend propagation. The smoothed rectified EMG profiles from all reaching movements in the same animal were aligned at the bend time and averaged. A–D, Averages from different animals. Thevertical dashed line marks the bend time. The scheme in the insets shows the location of the electrode wire (bold line) in the transverse section of the arm.

