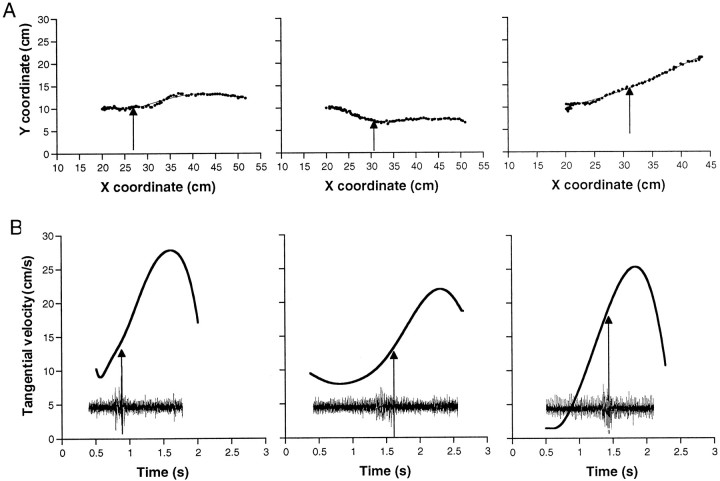
Fig. 7.
Bend-point trajectories during reaching movements.A, Bend-point path measured in different trials. Thedots are the measured positions, and thelines are the fitted fifth-order polynomial. Thearrows mark the point measured from the video frame in which the bend passed the electrode. The movement direction is from left to right. B, The bend-point tangential velocity plotted against time, calculated from the smooth movement path during the trials in A. The arrows mark the bend time. The insets show the corresponding EMG recording plotted on the same time axis as the velocity profiles.

