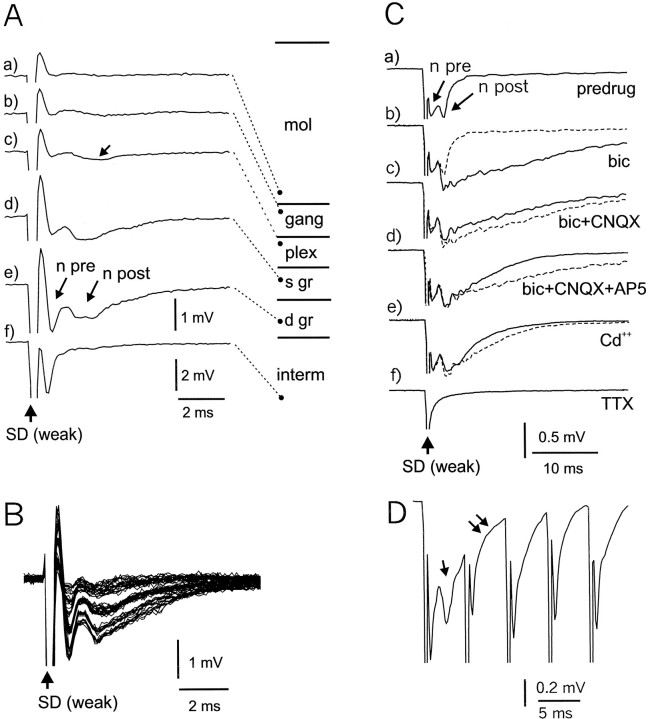
Fig. 2.
Field potential responses to weak stimulation of deeper layers. A, Responses recorded in different layers of ELL. In c, the arrow points to a small negative wave that may reflect excitation in the plexiform layer. Ine, n pre is probably caused by a presynaptic volley in primary afferent fibers, and n post is probably caused by a postsynaptic response in cells of the granule layer. Amplitude calibration for tracesa–e is shown below tracee. Amplitude calibration for trace f is shown below trace f. s gr, Superficial granule layer; d gr, deep granule layer. In this figure and in other similar figures, the recording site for each trace is indicated by the location of a filled circle on the associated diagram of ELL layers that is connected to the trace by astraight dashed line. B, All-or-none changes in response amplitude to deep layer stimulus of continuously increasing intensity. C, Pharmacology of granule layer response to weak stimulation of the deep layers. All recordings were made at the same site in response to the same stimulus. All are averages of 15 sweeps. The dotted lines show the trace preceding the indicated pharmacological effect. Note that the postsynaptic component changes but that the presynaptic does not, indicating that the afferent input volley is not affected by the drugs.a, Predrug control; b, effect of bicuculline (bic; 35 μm), note early onset; c, effect of bicuculline plus CNQX (30 μm), note early onset; d, effect of bicuculline, CNQX, and AP-5 (30 μm), note later onset of AP-5 effect; e, cadmium (200 μm), note that postsynaptic response remains prominent. D, Effect of high-frequency stimulation on presynaptic and postsynaptic components; five stimuli at 200 Hz. Single arrow points to prominent postsynaptic component that is only present after the first stimulus. Double arrows point to slowly rising negativity that may reflect an electrical EPSP.

