
Fig. 3.
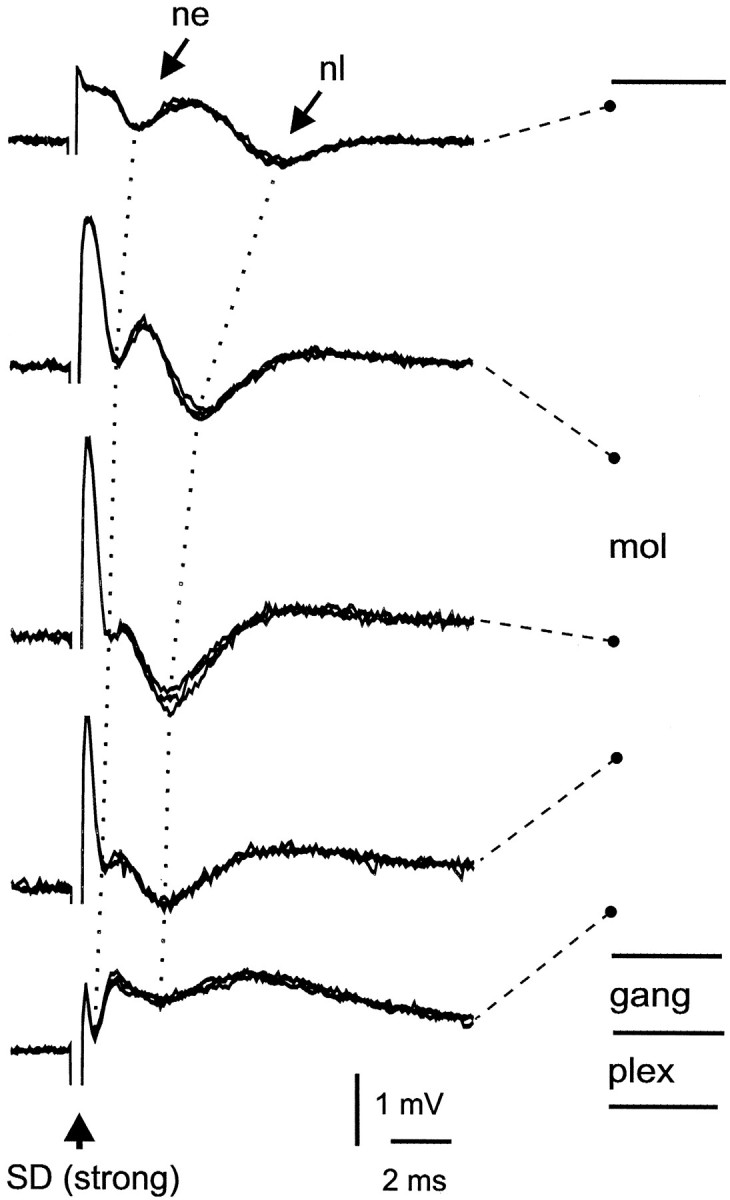
Field potential responses to strong stimulation of deeper layers. ne and nl indicate early and late negative waves. Dotted lines indicate the changes in latency of these waves between sites in the deep molecular layer and sites in the superficial molecular layer.