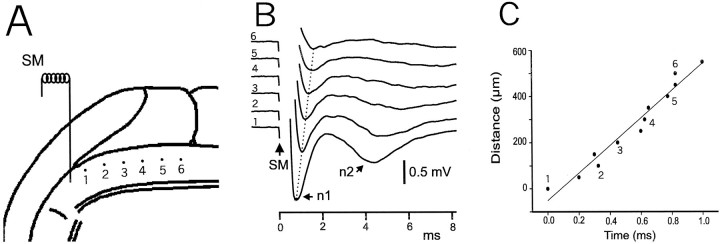
Fig. 5.
Field potentials in response to molecular layer stimulus recorded along the parallel-fiber beam with measurement of conduction velocity. A, Diagram showing location of stimulating and recording electrodes. Numbers refer to recording sites for the traces shown in B.B, Recorded traces. Dotted line indicates latency shift of n1 potential along the parallel-fiber beam.C, Graph showing changes in latency of the n1 peak as a function of distance from recording site 1. Numbersrefer to the recording sites shown in A andB. Additional points recorded in the same series between these numbered sites are also indicated. The line shows the best linear fit to all these points and indicates the conduction velocity.

