
Fig. 10.
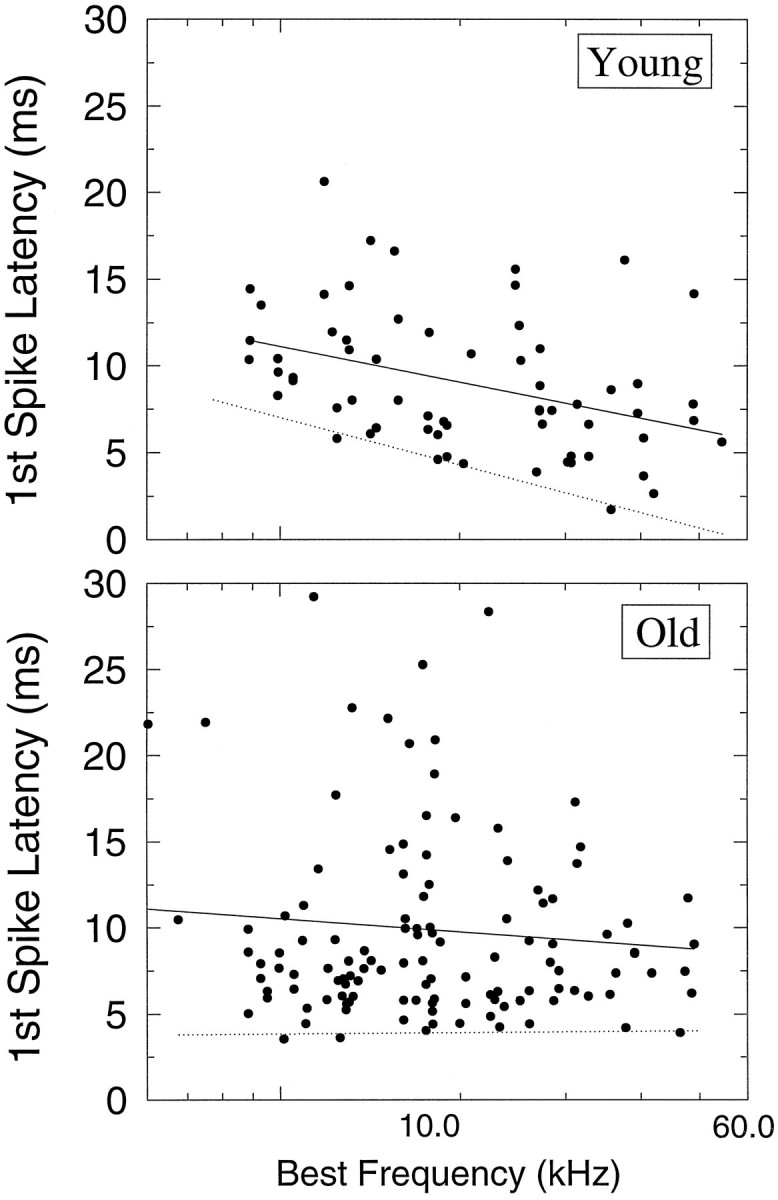
Mean first spike latency distributions and regression analyses plotted as a function of BF for young (top) and old (bottom) units. All response latency measures were derived from noise bursts presented at 65 dB SPL. To measure only spikes evoked by the signal, the analysis period was restricted to the first 25 msec after response onset, as measured from the PSTHs of a unit, for phasic units (ON, ONs, and ON–OFF) and 50 msec for tonic units (PL and SUST). Response latencies ranged from 3 to 22 msec in the young distribution and from 3.3 to 28 msec in the old distribution. Acoustic delays were subtracted from the raw latency values using a linear regression used to fit the data (solid line). The dotted line (fit by eye) highlights the gradient of shortest first spike latencies in both young and old distributions.