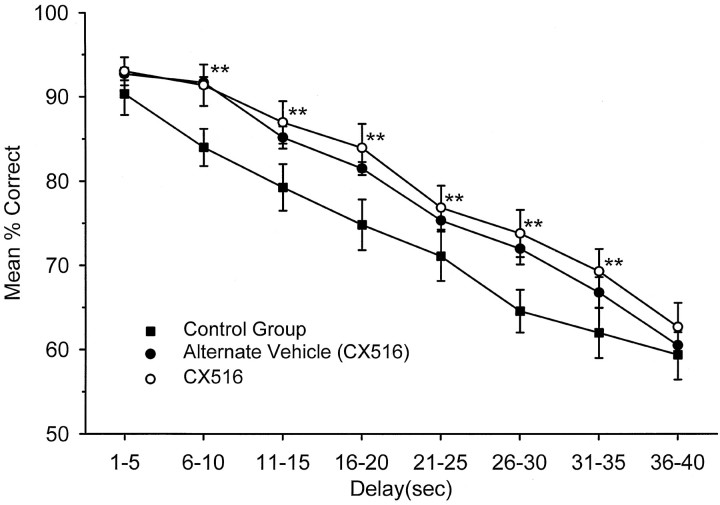
Fig. 2.
Mean percent correct performance as a function of delay for CX516 and Control groups averaged over days 9–25. Curves were calculated for the nine sessions during which drug (35 mg/kg) was administered (open circles) to the CX516 group, and separately for the 8 alternate vehicle days for the same group (filled circles). Curve withfilled squares shows performance over the same 17 d period for the six animals in the Control group that received only vehicle injections. Trials were sorted by delay as in Figure 1 and plotted as mean (±SEM) performance across all trials and animals.Asterisks indicate significantly (**p < 0.001) different performance from Control group.

