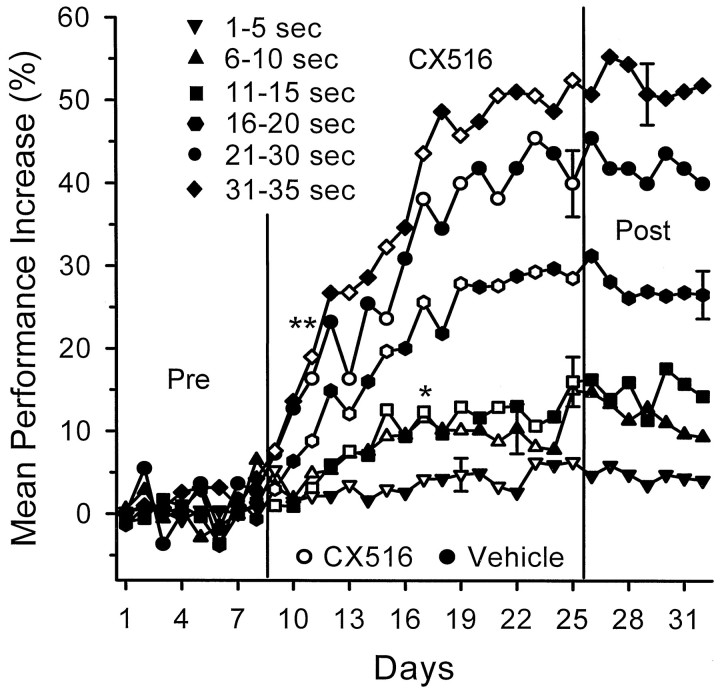
Fig. 4.
Mean percent change in DNMS performance over days for animals receiving CX516 (n = 9) plotted for trials sorted by length of the delay interval (in 5 sec intervals). Trials with 21–25 and 26–30 sec delays were combined as 21–30 sec delays, because the two intervals did not differ in mean performance increase. The 36–40 sec delays are not shown because they were similar to the 1–5 sec data, which were not significantly increased over control levels (Fig. 2). Performance was plotted as percent increase from baseline before drug administration (see Fig. 3), with the baseline (0%) calculated separately for each delay (see Results). Error bars indicate the largest SEM within each curve. Open symbols indicate days on which CX516 was administered;filled symbols indicate vehicle administration.Asterisks indicate significant increase from Control group on that day (*p < 0.01; **p < 0.001). Pre, CX516, andPost are as indicated in Figure 3.

