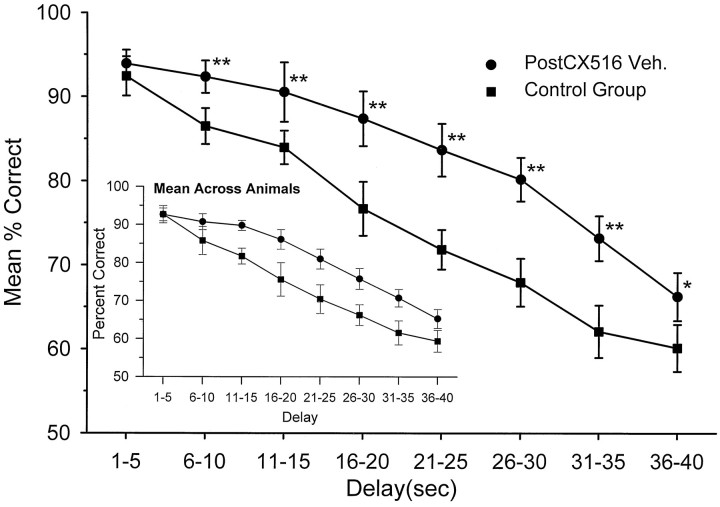
Fig. 5.
Mean performance curves for CX516 and Control group over days 26–32 (PostCX516 Veh.) indicate that behavioral performance remained elevated for at least 1 week after drug was discontinued. Mean DNMS performance (see Fig. 3) for all trials across all animals at a given delay for the CX516-treated (circles) and vehicle-only Control (squares) groups. The inset indicates the mean (and SEM) across animals for the same data (see Fig. 3).Asterisks indicate significant performance increases within the 5 sec intervals compared with Control group (*p < 0.01; **p < 0.001).

