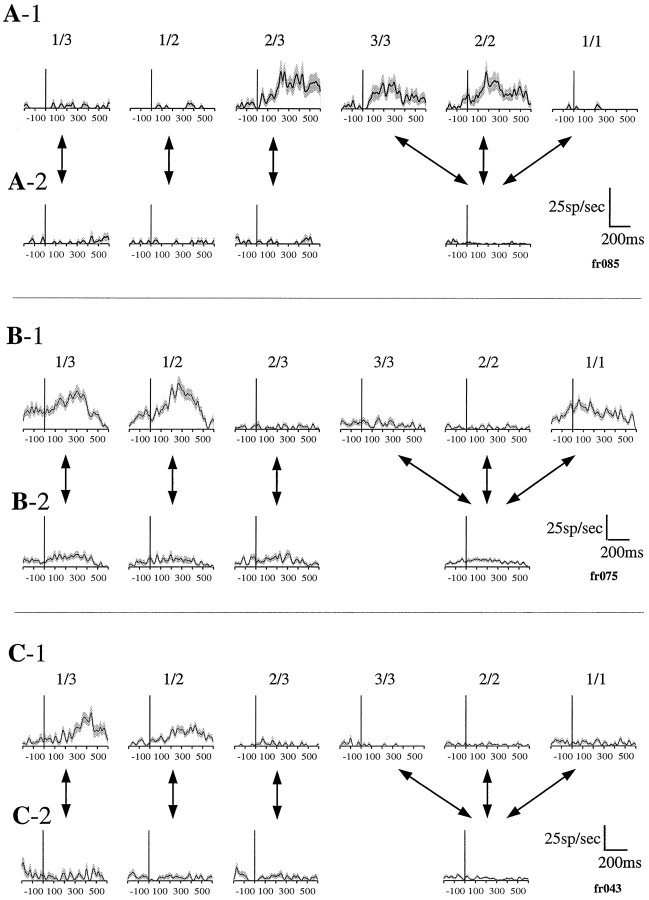
Fig. 9.
Spike density plots of the activity of three neurons that responded to the appearance of the schedule fraction cue.A–C, Vertical lines(y-axis) indicate the onset of the appearance of the cue. 1, Plots that indicate the neuronal responses in the brightening paradigm sorted by the schedule fraction.2, Plots that indicate the neuronal responses in the random paradigm sorted by the cue brightness. A, An example of a neuron from group 1 that responded in 2/3, 3/3, and 2/2 in the brightening paradigm. B, An example of a neuron from group 2 that responded in 1/3, 1/2, and 1/1 in the brightening paradigm. C, An example of a neuron from group 3 that responded in 1/3 and 1/2 in the brightening paradigm.

