
Fig. 9.
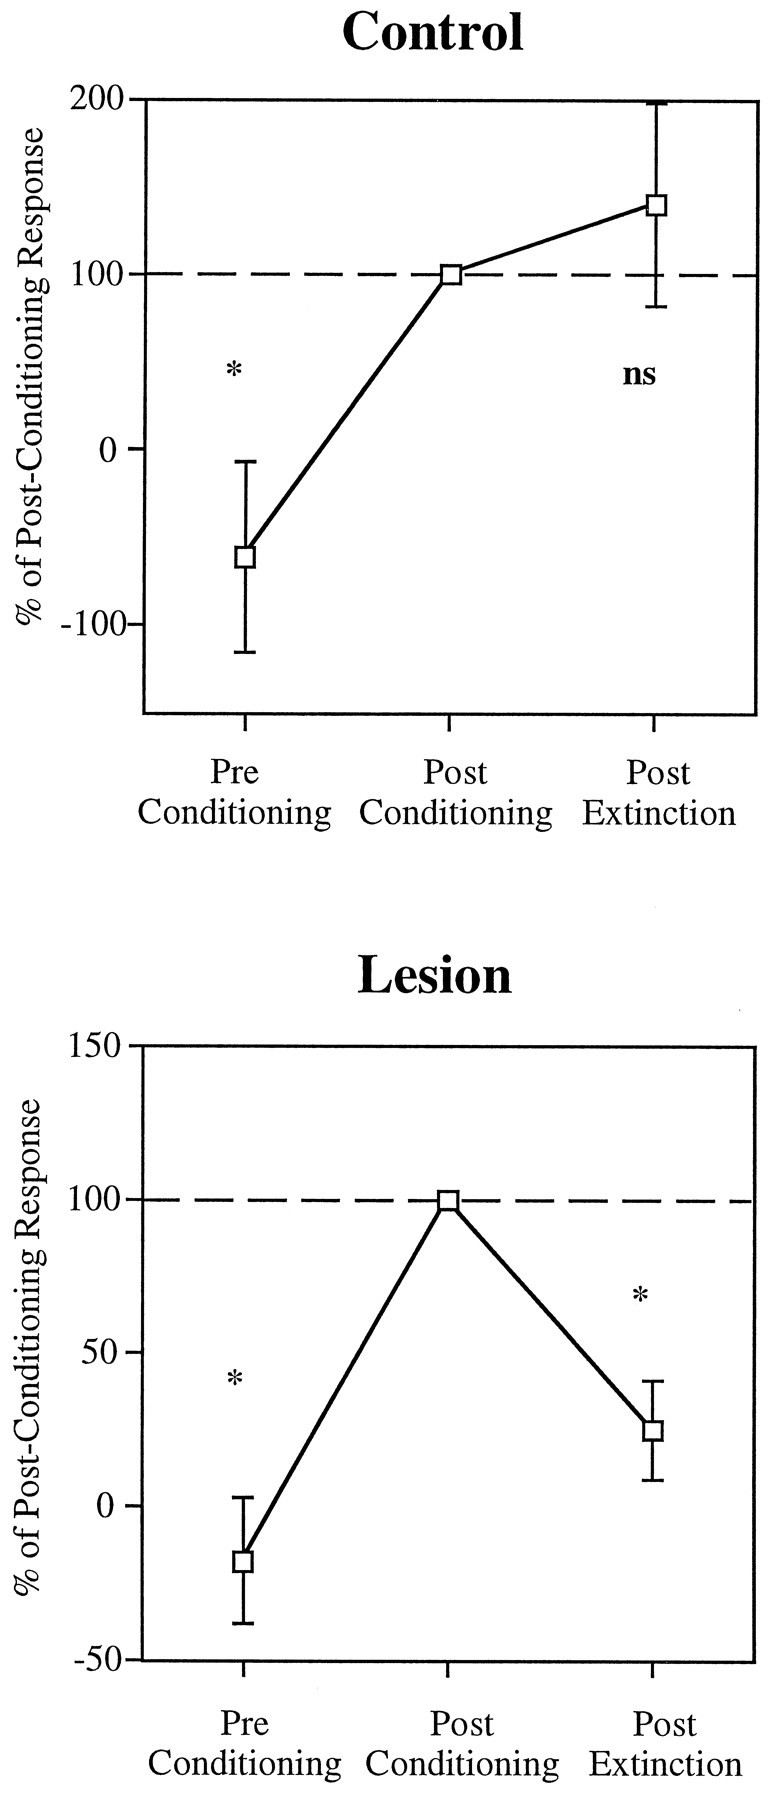
Average onset tone responses (0–50 msec) of cells that conditioned, from the control and lesion groups, plotted for the 10 sensitization trials (Pre Conditioning), the first 10 trials of extinction (Post Conditioning), and the last 10 trials of extinction (trials 20–30; Post Extinction), relative to the postconditioning tone response. In both groups, tone responses before conditioning were significantly smaller than after conditioning (p < 0.01). In the control group, the responses at the end of extinction did not differ from the postconditioning values (p> 0.1), whereas in the lesion group extinction trials resulted in a significant reduction of the tone responses (p < 0.005).