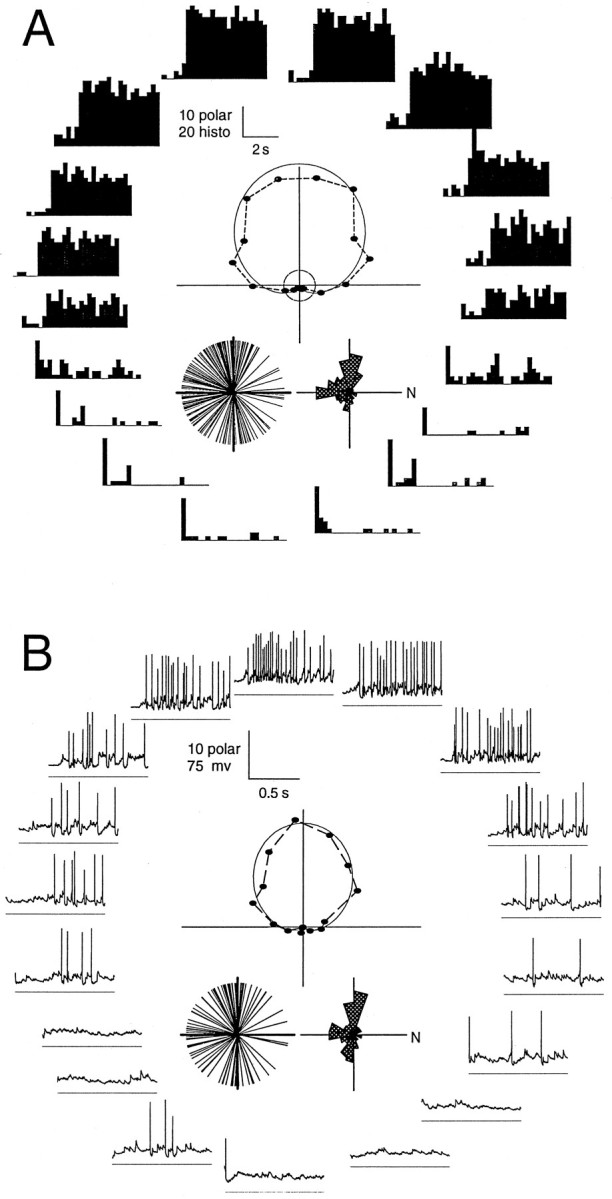
Fig. 1.

Extracellular versus whole-cell patch recordings from the BON. Direction tuning of visual responses was recorded by each technique using an identical full-field stimulus generated on the computer monitor. Both sets of data show direction tuning in response to 18 stimulus directions. The polar positions for the two cells were rotated to align their preferred directions. A, Extracellular data are displayed as 5 sec peristimulus spike histograms that include a preceding 0.8 sec period before stimulus motion onset.B, Intracellular data are displayed as individual 1 sec voltage traces during a single stimulus presentation. At the fast time scale of these traces, the response latency inherent in retinal processing and conduction to the BON are evident. Below each trace is ahorizontal −80 mV reference line. Within each panel are polar plots derived from responses averaged from the total stimulus duration for each direction (18 sec extracellular, 12 sec intracellular). These graphs plot the event frequency as the length from the origin and the stimulus direction as the plot angle relative to nasal visual field motion (to the right). In addition to the data points, a curved line shows a computer-generated fit, from which the preferred direction was measured. Insets below each polar plot, Distributions of preferred directions of each sample, both as a single line for each cell and as a polar histogram of 20° bins.
