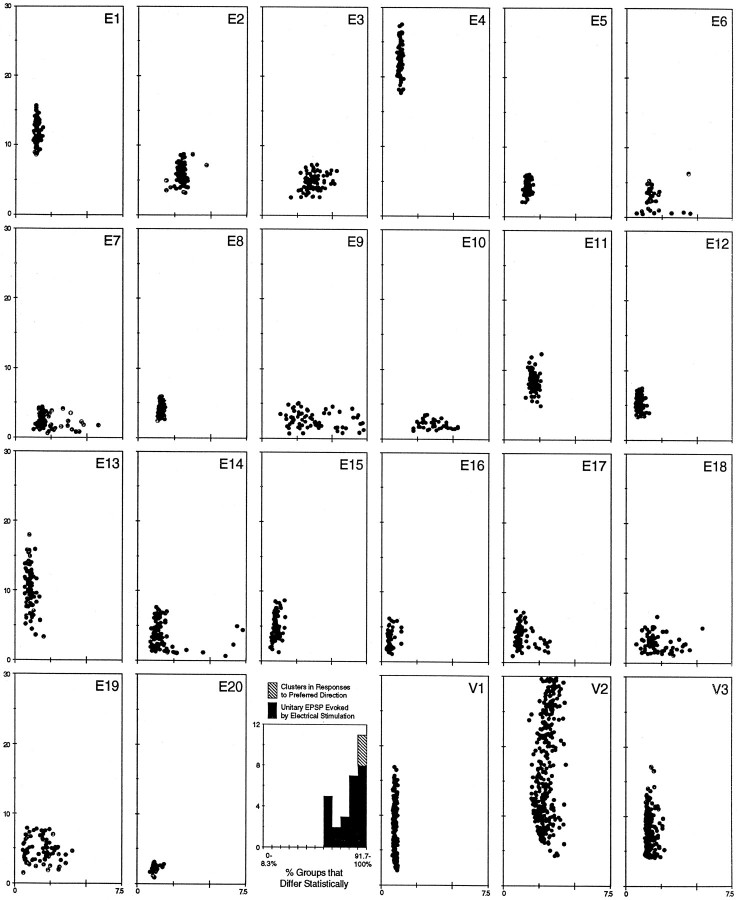
Fig. 5.
Comparison of visual evoked clusters and electrically evoked unitary EPSPs. Twenty unitary EPSP scatterplots are displayed in the three top rows and left side of the bottom row (E1–E20).V1–V3, Scatterplots of cluster 2 (from Figs. 4, 6, 7, respectively) shown on the right side of thebottom row. These plots all have amplitude in millivolts on the ordinate and rise time in milliseconds on theabscissa. All scatterplots are displayed on the same scale, although the number of points in each plot varied because of electrical stimulation failures caused by near threshold current stimulation or different recording times during visual stimulation. Five unitary EPSP scatterplots, the mean rise time of which was >5 msec, are not shown from Kogo and Ariel (1997), their Figure 11. The histogram between E20 and V1 displays the number of EPSP groups as a function of the percentage of remaining groups that were statistically different based on amplitude and/or rise time.

