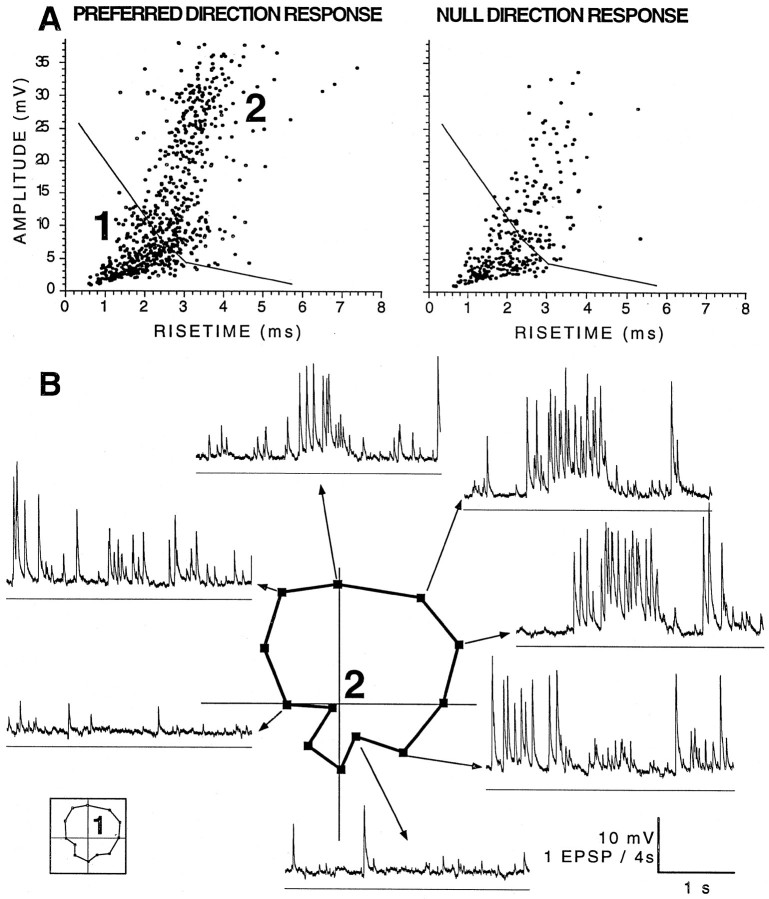
Fig. 6.
Inability of cluster analysis to divide some large clusters. A, Amplitude–rise time scatterplots showing the distribution of EPSP shapes recorded in a BON cell hyperpolarized to −90 mV during equivalent 40 sec periods (8 sec of local pattern motion in 5 preferred and 5 null direction presentations). From the preferred data of the left panel, the boundaries for two clusters were identified objectively. Stimuli and analyses were similar to those of Figure 4, except that the white squares were 2.8° within a window of only 5.8° square. B, Intracellular data are displayed as individual 2 sec voltage traces for 7 of the 12 stimulus directions. Below each trace is a horizontal−100 mV reference line. The polar plot in the center represents the direction tuning of the events in cluster 2.Inset to left shows the cluster 1 polar plot.

