Fig. 7.
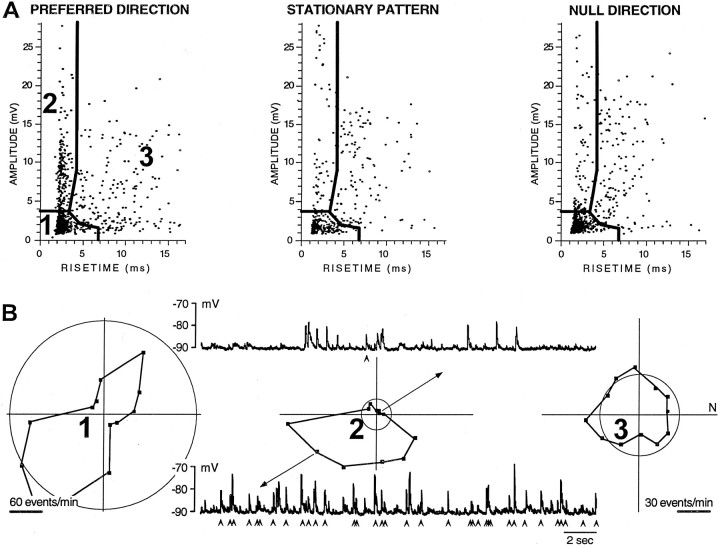
Identification of individual EPSPs from one cluster within a voltage trace. A, Amplitude–rise time scatterplots showing the distribution of EPSP shapes recorded in a BON cell hyperpolarized to −90 mV during equivalent 120 sec periods (two 1 min presentations interleaved for local pattern motion in 12 directions and a stationary condition). From the preferred direction data of theleft panel, the boundaries for three clusters were identified objectively. Note that cluster 2 has many more events during the preferred direction than during null direction, except for possible contamination at its lowest boundary.B, Three polar plots show the direction tuning of events for each cluster identified in A using the preferred and null direction scatterplots, as well as 10 other scatterplots (data not shown). The circle on each plot shows the spontaneous events derived from the stationary stimulus condition (A, middle). Above and below the middle polar plot of cluster 2 are 15 sec voltage traces during null and preferred responses, respectively. Below each trace arearrowheads to identify events, the amplitude and rise time of which fall within the boundaries of cluster 2. Note that all but one of the EPSPs in this null direction trace had either an amplitude <3.8 mV or a rise time >4 msec. Note that the calibration of the left polar plot is twice that of theright two plots. There were many more events in cluster1 than the other two clusters, and those events were inhibited by stimulus motion.

