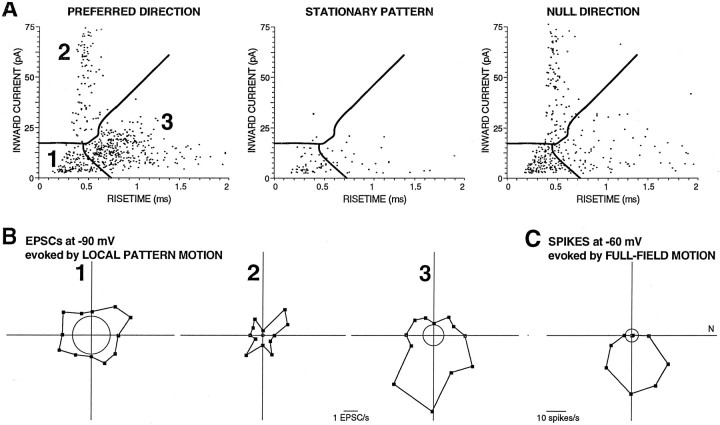
Fig. 8.
Direction tuning of EPSC responses during motion of a very small pattern. A, An amplitude–rise time scatterplot showing the distribution of EPSC shapes recorded in a BON cell recorded in voltage-clamp mode with its membrane held to −90 mV during local pattern motion (2 12 sec presentations) during preferred direction motion, no motion, and null direction motion (stimulus window, 3.4° square). Clusters were objectively determined from the shapes of the events during preferred direction motion.B, Polar plots based on the boundaries of the three clusters shown in A. C, A polar plot shows the direction tuning of the spike output of the same BON cell recorded in current-clamp mode with its membrane held to −60 mV during full-field visual pattern motion. This direction sensitivity is similar to that of cluster 3 shown in B.

