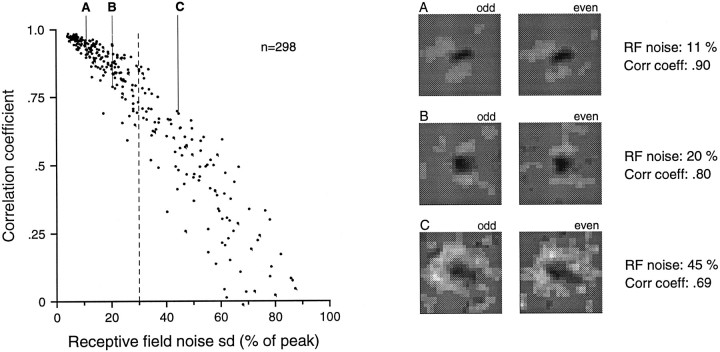
Fig. 12.
RF repeatability. Examples of three pairs of independent RF estimates from three cortical neurons are shown on theright. Two independent RF estimates for each neuron were computed from spike data collected on even- and odd-numbered drum scans, respectively (see the Results). The correlation coefficients plotted on the y-axis of the graph on theleft and displayed to the right of each pair of RFs are correlations of the 625 paired RF weights of the two independent RF estimates from each neuron. The x-axis represents the RF noise index displayed in Figure 11. Note that the noise index for each RF in this figure is based on half the data and is thus √2 greater than the noise index of the RF obtained from all the data. The labels A, B, andC above the example RFs are keys topoints in the graph on the left.A and B were chosen to illustrate the less repeatable cases among neuronal RFs with noise indices near 10 and 20%, respectively. C was chosen to show how good the repeatability can be even when the noise index is over 40%, which is well above the cutoff (dashed vertical line) used in this study for measuring RF parameters.

