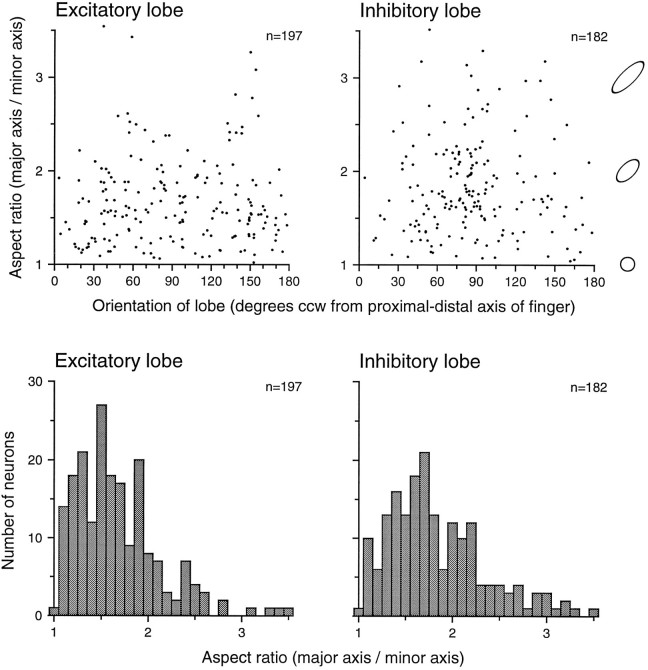
Fig. 9.
Elongation and orientation of dominant excitatory and inhibitory RF lobes. Dominant lobes [defined as continuous regions of RF excitation (inhibition) that contained at least 80% of the total excitatory (inhibitory) mass] were fitted with a two-dimensional Gaussian function to obtain ellipsoidal descriptors of orientation and elongation (see Results). Top row, Thex-axis of each graph represents the angle of the lobe’s major axis relative to the finger axis. The y-axis represents the ratio of the lengths of the best-fitting ellipsoidal major and minor axes. Ellipses at theright illustrate aspect ratios of 1.0, 2.0, and 3.0.Bottom row, Distributions of excitatory and inhibitory aspect ratios are shown. The x-axis represents the aspect ratios of the excitatory and inhibitory lobes. They-axis values represent the number of neurons with each aspect ratio.

