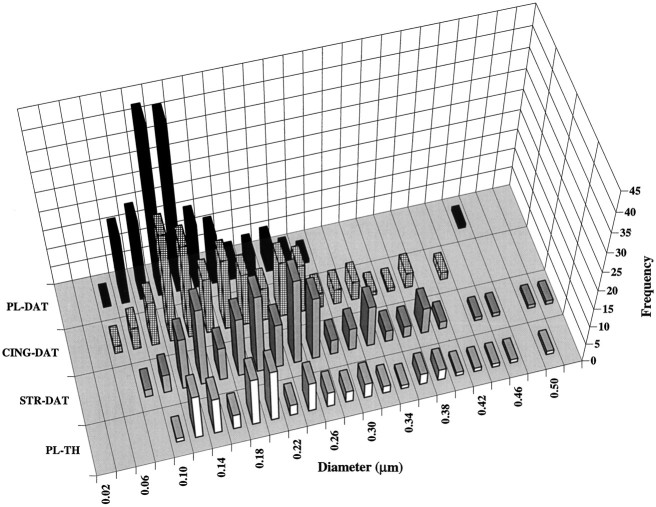
Fig. 6.
Histogram illustrating the frequency of diameters measured for profiles immunoreactive for DAT or TH in the rat forebrain. Each bar represents the total number (frequency) of profiles having a particular diameter that were immunoreactive for DAT in the prelimbic cortex (PL,black), anterior cingulate cortex (CING,hatched), or dorsolateral striatum (STR,gray) or for tyrosine hydroxylase in the prelimbic cortex (TH, white). For each region 30 profiles for each of six animals are represented in the case of DAT and for each of three animals in the case of TH. The histogram includes all of the raw data from which means and SD were calculated; see Results for the statistical analysis.

