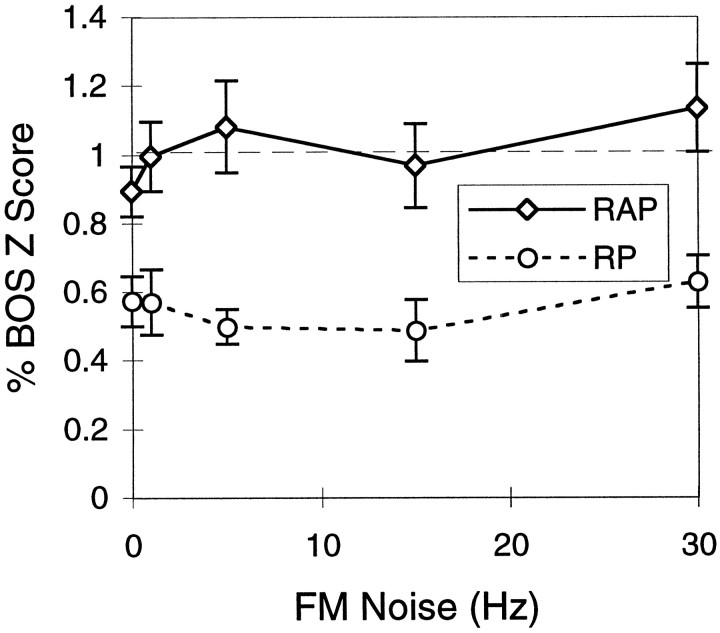
Fig. 12.
Mean HVc response curves to synthetic songs that had various amounts of FM noise added to each frequency band. Thex-axis shows the amount of noise expressed as 1 SD of the additive Gaussian noise. The RAP stimuli were generated by adding the same FM noise to each band and therefore preserving the relative instantaneous phase (n = 43 for FM = 0,n = 22 for FM = 1, n = 23 for FM = 5, n = 23 for FM = 15, andn = 25 for FM = 30). The RP stimuli had different FM noise added in each band (n = 28 for FM = 0, n = 24 for FM = 1,n = 25 for FM = 5, n = 15 for FM = 15, and n = 26 for FM = 30). For both cases, the absolute phase was random. The error bars show 1 SEM.

