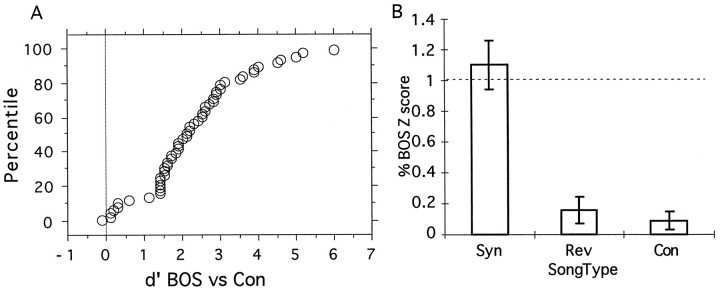
Fig. 4.
A, Cumulative probability distribution of the measure d′ from signal detection theory for the discriminability between the BOS and conspecific songs (Con), calculated from the neural responses obtained at 54 recording sites. B, Response, measured as a percent of the response to the BOS, for the synthetic song that preserved all of the parameters obtained in our decomposition (Syn), for the song played in reverse (Rev), and for conspecific songs (Con). The data are obtained fromn = 30 for Syn,n = 39 for Rev, andn = 47 for Con (nrefers to the number of recording sites). The error bars show 1 SEM.

