
Fig. 4.
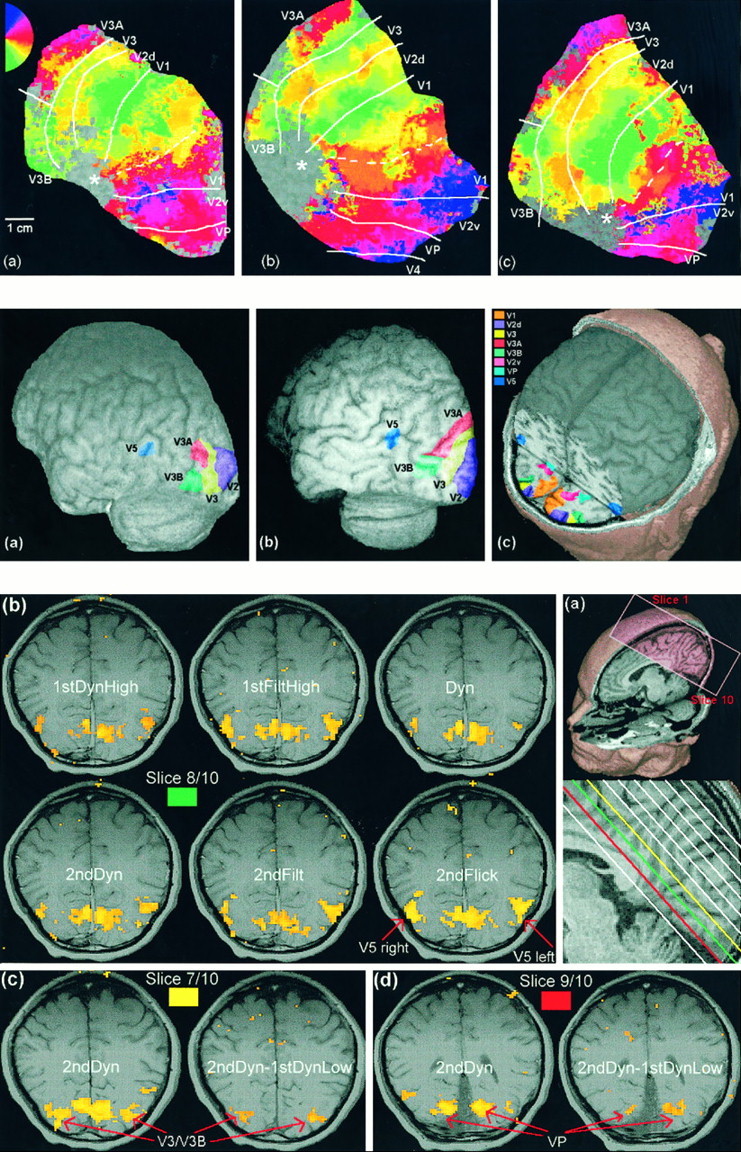
Top. Maps of the posterior cortex of three subjects obtained by simulating flattening of the gray matter.a–c, The left hemisphere is shown in all cases; similar results were obtained in the right hemispheres. Overlaid on the map is a pseudocolor representation of the phase of the fundamental component of the activation time course elicited by a rotating, flickering checkerboard (see Materials and Methods). Thecolors reflect visual field position (seekey in a) and show a smooth progression through the visual field within each visual area, with a reversal of the direction of change at the boundaries. Estimates of the locations of various boundaries are indicated. The dotted white line shows the approximate location of the fundus of the calcarine sulcus. The approximate position of the occipital pole is marked with a star.