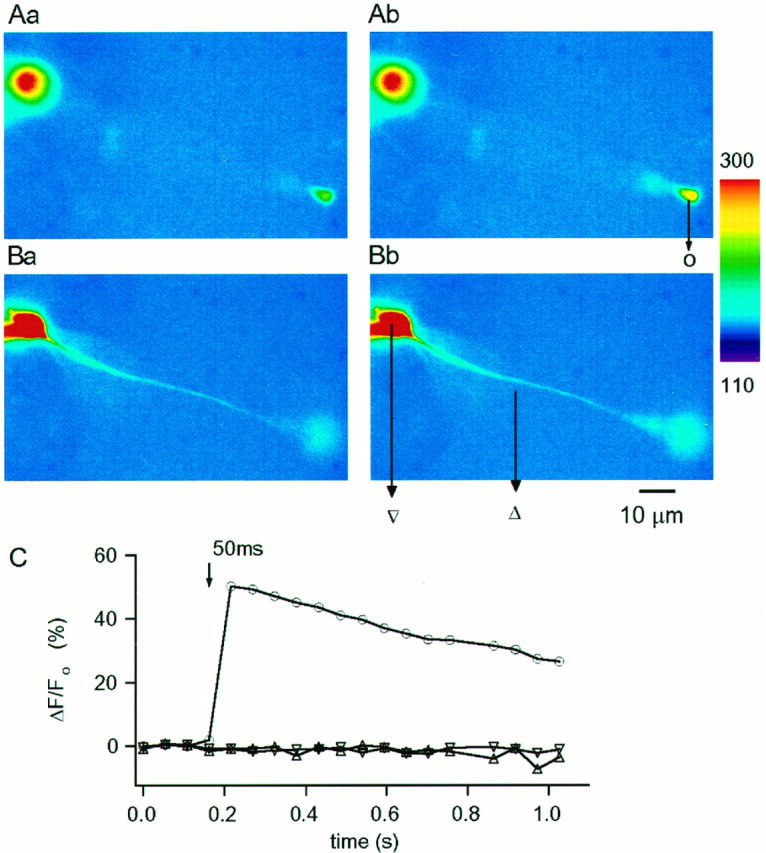
Fig. 5.

Spatial distribution of pulse-evoked [Ca2+]i rises detected with the low-affinity dye OG5 (200 μm). A,B, Pseudocolor images of Ca2+-dependent fluorescence at rest (Aa, Ba; Vh, −70 mV) and during a 50 msec pulse to −30 mV (Ab,Bb). A and B were taken at different focal planes optimized for the terminal in Aand for the axon in B. Camera exposure time was 20 msec, and cycle time for image acquisition was 52 msec. C, Temporal evolution of the relative changes in fluorescence measured in discrete ROI (see Materials and Methods) as indicated in the image:triangle represents axon, inverted triangle represents soma, and circle represents terminal. The depolarization-evoked change in fluorescence is restricted to the bipolar terminal. In this and the following figures the slices were bathed in the standard control saline (2 mmCa2+). Pipettes were filled with a CsGlu-based solution (no EGTA) as detailed in Materials and Methods.
