Fig. 6.
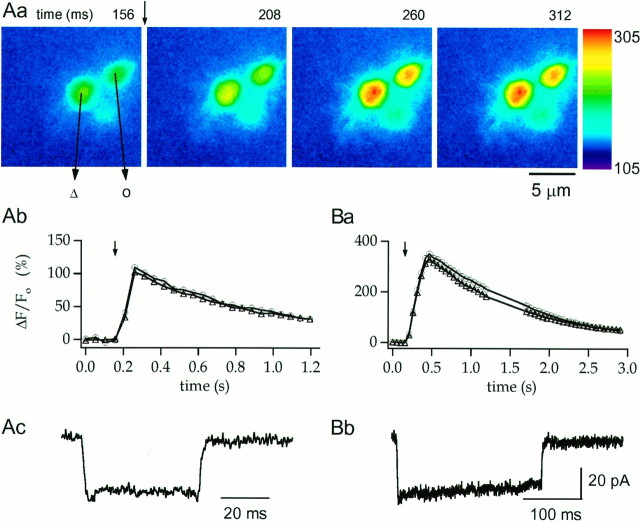
Modulation of terminal [Ca2+]i rises by pulse duration.Aa, Time sequence of OG5 pseudocolor images from the synaptic terminal region of an RBC. The first panelcorresponds to the fourth image in a series taken at rest (cycle time, 52 msec). A 50 msec depolarization to 0 mV, applied immediately after the end of this image (time, 156–206 msec), elicits substantial increases in fluorescence throughout the terminals that begins to decay when the membrane potential returns to Vh.Ab, Ac, Temporal evolution of the percent of fluorescence change and the correspondingICa for the experiment shown inAa. Ba, Bb, Temporal evolution of the percent of fluorescence change and the correspondingICa for a 250 msec depolarization in the same cell. Note that for a given pulse duration, the pulse-evoked changes in fluorescence have similar magnitudes and time courses in the two terminals analyzed. Internal solution was CsGlu (200 μm OG5, no EGTA).

