
Fig. 4.
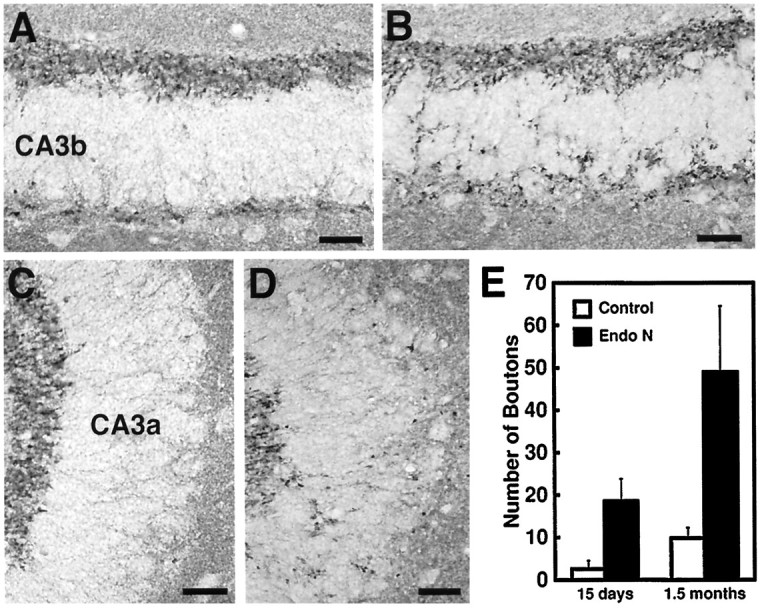
Mossy fiber terminal bouton distribution in the subfields CA3b (A, B) and CA3a (C, D) of 15-d-old control (A, C) and endo N-injected (B, D) CF1 mice as revealed by synapsin I immunohistochemistry. A quantitation of mossy fiber bouton density in the subfield CA3a of control and endo N-injected mice is shown inE. In control animals, a large number of mossy fiber boutons are seen in the suprapyramidal and infrapyramidal mossy fiber band, and only a few are distributed within the pyramidal cell layer. Significant differences were observed between control and endo N-treated mice at both P15 and 1.5 months. In endo N-treated mice, a larger number of boutons are seen scattered within the pyramidal cell layer. Error bars indicate SD; p < 0.0001. Scale bar, 25 μm.