
Fig. 13.
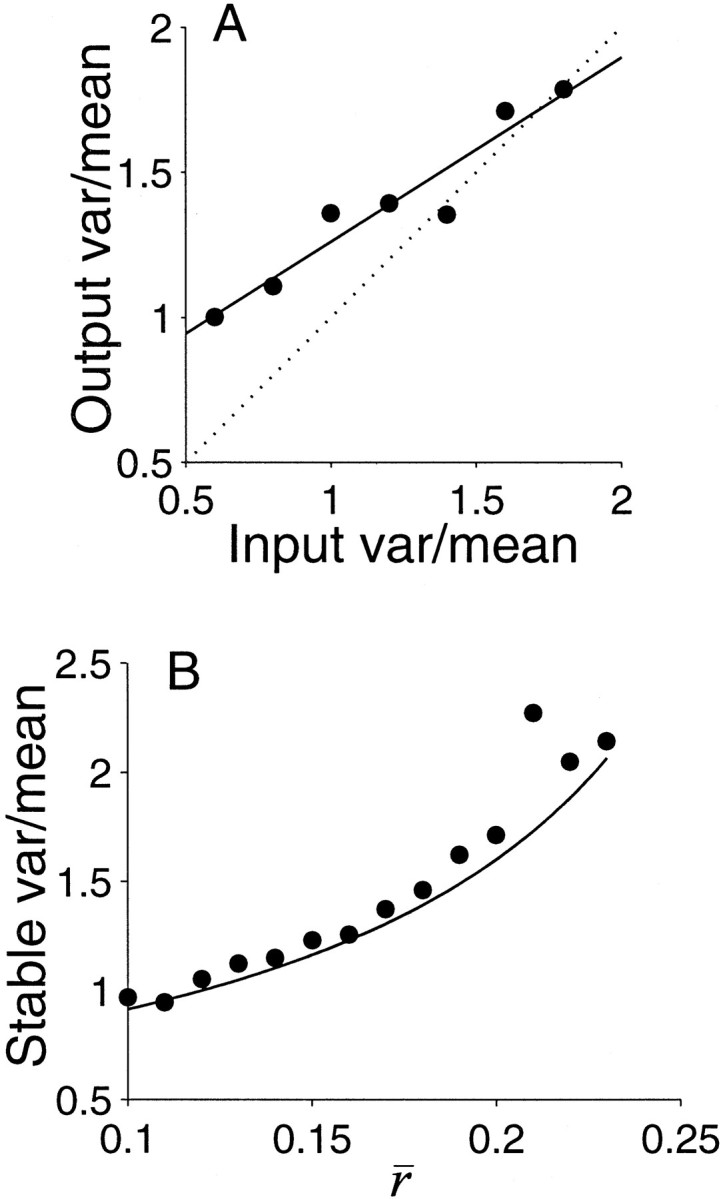
Stable solution for the variance-to-mean spike count in networks of neurons when the computation involves three independent quantities. A, Numerical approximation to the stable solution. We simulated the response by estimating three values using 100 weakly correlated neurons per value ( = 0.2). The three means were combined as a sum and difference (a + b − c) to generate the expected spike count from the output neuron, the spike train of which was modeled as a renewal process with CVISI = 0.8. The variance-to-mean ratio for the input neurons is shown along theabscissa. The output variance-to-mean ratio is plotted along the ordinate. The least squares fit line crosses the main diagonal at a ratio of 1.6. This variance-to-mean ratio would be common to input and output neurons that compute similarly complex quantities. B, Effect of correlation on the stable variance-to-mean ratio. Each point represents a numerical approximation like the one obtained in A. The procedure was repeated for a range of average correlation coefficients. The solid line is the theoretical result (Eq. 18). Simulations led to larger estimates of variance, because the number of neurons is finite.