
Fig. 4.
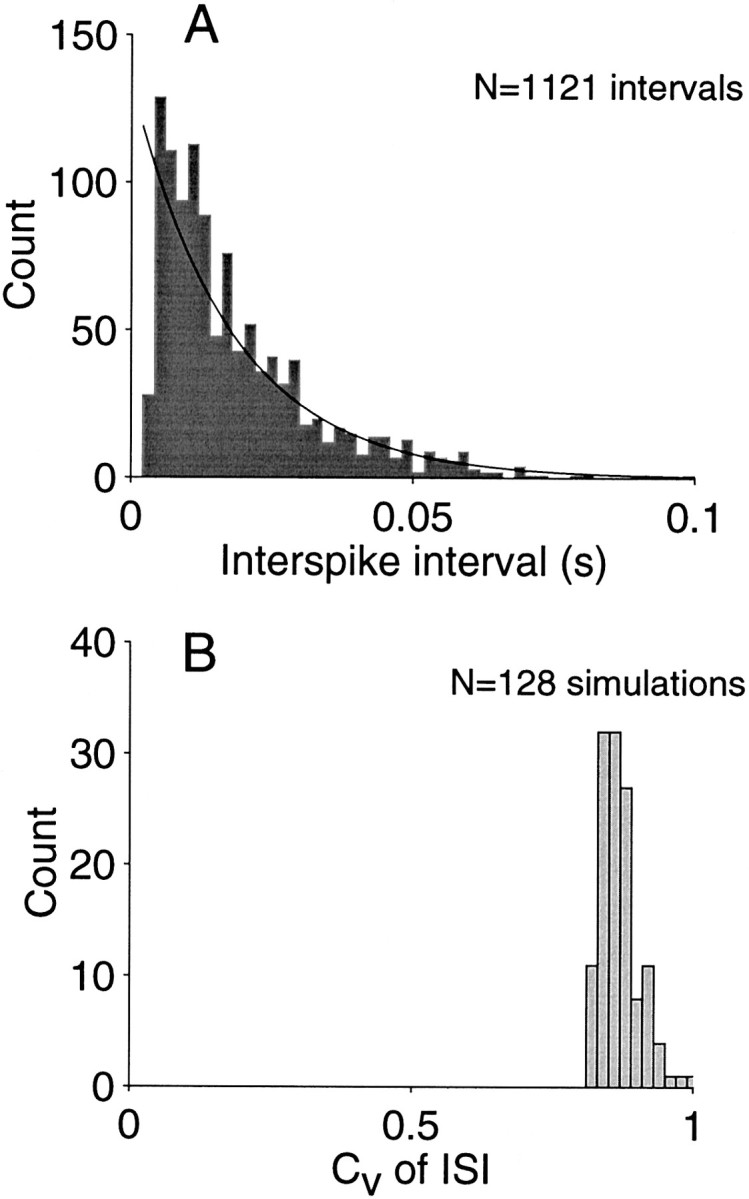
Variability of the interspike interval. A, Frequency histogram of ISIs from one simulation using 300 inputs at 50 spikes/sec. Notice the substantial variability. The SD divided by the mean interval is known as the coefficient of variation of the interspike interval (CVISI). The value for this simulation is 0.9. The distribution is approximated by an exponential probability density (solid curve), which would predict CVISI = 1. B, Coefficient of variation of the interspike interval (CVISI) from 128 simulations using 300 and 600 inputs and a variety of spike rates. Each simulation generated 20 sec of spike discharge using parameters that led to a similar rate of discharge for input and output neurons (i.e., a common dynamic range). The average CVISI was 0.87.