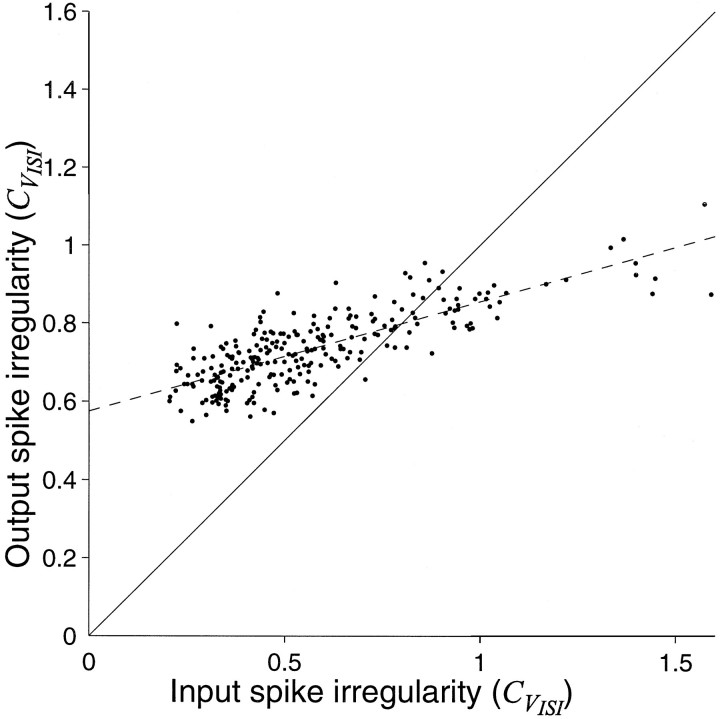
Fig. 5.
Irregularity of the spike discharge is not merely a reflection of input spike irregularity. The graph compares the irregularity of the ISI produced by the balanced excitation–inhibition model with the irregularity of the intervals constituting the 300 excitatory and inhibitory input spike trains. The input spike trains were constructed by drawing intervals randomly from a gamma distribution. By varying the parameters of the gamma distribution, the input CVISI was adjusted from relatively regular to highly irregular (abscissa). Eachpoint represents the results of one simulation, using different parameters for the input interval distribution. Notice that the degree of input irregularity has only a weak effect on the distribution of output interspike intervals. Points abovethe main diagonal represent simulations in which the counting model produced a more irregular discharge than the input spike trains. Points below the main diagonal represent simulations in which the output is less irregular than the input spike trains. The dashed line is the least squares fit to the data. This line intersects the main diagonal at CVISI = 0.8. The best fitting line does not extrapolate to the origin, because the inputs are not necessarily synchronous.

